The Relationship Between Cognition and Cerebrovascular Reactivity: Implications for Task-Based fMRI
 Rebecca J. Williams
 M. Ethan MacDonald1,2
  G. Bruce Pike
- 1Department of Radiology, Clinical Neuroscience and Hotchkiss Brain Institute, University of Calgary, Calgary, AB, Canada
- 2Department of Electrical and Software Engineering, University of Calgary, Calgary, AB, Canada
- 3Department of Psychology, St. Francis Xavier University, Antigonish, NS, Canada
Elucidating the brain regions and networks associated with cognitive processes has been the mainstay of task-based fMRI, under the assumption that BOLD signals are uncompromised by vascular function. This is despite the plethora of research highlighting BOLD modulations due to vascular changes induced by disease, drugs, and aging. On the other hand, BOLD fMRI-based assessment of cerebrovascular reactivity (CVR) is often used as an indicator of the brain's vascular health and has been shown to be strongly associated with cognitive function. This review paper considers the relationship between BOLD-based assessments of CVR, cognition and task-based fMRI. How the BOLD response reflects both CVR and neural activity, and how findings of altered CVR in disease and in normal physiology are associated with cognition and BOLD signal changes are discussed. These are pertinent considerations for fMRI applications aiming to understand the biological basis of cognition. Therefore, a discussion of how the acquisition of BOLD-based CVR can enhance our ability to map human brain function, with limitations and potential future directions, is presented.
Introduction
Cerebrovascular reactivity (CVR) reflects the ability of the cerebral blood vessels to respond to a vasoactive stimulus and is primarily sensitive to arterial compliance [1, 2]. Blood oxygenation level-dependent (BOLD) functional MRI is an effective technique for measuring CVR. The BOLD signal originates from changes in the local concentration of deoxyhemoglobin (dHb), which primarily occurs in the post-arteriolar component of the cerebral vasculature. The change in the local concentration of dHb is predominantly driven by increases in cerebral blood flow (CBF), which reduces venous dHb via a dilution effect and thus increases the BOLD signal [3, 4]. In conventional task-based or resting-state BOLD fMRI, increases in the cerebral metabolic rate of oxygen (CMRO2) and cerebral blood volume (CBV) associated with increased neuronal activity both act to increase dHb and hence attenuate the CBF dominated BOLD signal increase. With a direct vasodilator stimulus used for CVR mapping, such as carbon dioxide (CO2), CMRO2 changes are assumed to be negligible and a robust positive BOLD signal is measurable that primarily reflects the increase in CBF [5, 6]. CVR can also be measured using other MRI techniques including those sensitized exclusively to CBF (e.g., arterial spin labeling), macrovascular blood flow (e.g., phase contrast flow imaging), or CBV [1, 7–9]. In addition, there are non-MRI techniques available for measuring CVR, such as transcranial doppler, which measures blood flow velocity within the middle cerebral artery [10], and [15O] positron emission tomography [11, 12]. Yet BOLD fMRI is the more broadly used modality for CVR mapping in clinical and research settings owing to its sensitivity to vascular properties, combined with its safety, availability, higher spatial resolution, and reproducibility [13]. The sensitivity and spatial resolution of BOLD fMRI also explain its popularity as a cognitive neuroscience tool for mapping neural activity. Neural activity increases oxygen metabolism; however, BOLD signal increases occur in the context of increased CMRO2 due to coupled, but proportionally larger, CBF increases [14–16].
While CVR primarily assesses vascular compliance, it is also evident that CVR is linked to cognitive functioning. Much of this evidence has emerged from research investigating pathological conditions such as vascular disease and dementia, where both regulation of cerebral vasculature and cognitive function are affected [17–19]. There are differences in the underlying mechanisms leading to the resultant hyperemia in CVR and task-based BOLD activation, however both rely on vessel contraction and dilation. Furthermore, the BOLD response to hypercapnia has shown to account for a large amount of the task-induced BOLD variability [20]. Therefore, the aim of this paper is to review the link between CVR and cognitive processes, and to highlight the importance of acquiring CVR data to accompany task-based fMRI data when investigating the biological underpinnings of cognition.
The first two sections of this review outline how CVR and neural activity are mapped using BOLD fMRI. Initially, an overview of how changes in arterial CO2 are coupled to modulations in CBF are presented. The following section is focussed on task-based fMRI and discusses the mechanisms underpinning neurovascular coupling. Both of these sections emphasize recent findings. In sections Neurological Conditions and Normal Physiology, focus is shifted to example situations where both CVR and cognitive functioning are altered in the study population. We demonstrate that modulations to task-based BOLD activation are also often found in such cases, and provide the motives for collection of CVR data to aid the interpretation of fMRI activation maps. Neurological diseases hallmarked by vascular and microstructural variations are discussed in detail. However, vascular and cognitive alterations are also observed in normal physiology, such with caffeine consumption and aging, and this is discussed in section Normal Physiology. Finally, it has become increasingly clear that the integration of multiple imaging modalities improves our ability to map the human brain. Techniques for correcting BOLD-based assessments of brain activity using CVR (i.e., hypercapnic normalization) and the advantages and pitfalls of this analytical approach, are discussed in section Integration of BOLD-Based Assessments of CVR and Neural Activity: Hypercapnic Normalization.
CVR and Bold Signal
Cerebral blood flow (CBF) is normally controlled by regulatory mechanisms including cerebral autoregulation, the partial pressure of arterial blood gases, and neurovascular coupling (NVC) [21]. NVC is discussed in detail in section Neural Activity and BOLD Signal. Cerebral autoregulation keeps blood flow consistent with changing cerebral pressure. The Hagen-Poiseuille equation describes the changes in cerebrovascular resistance as:
Where blood flow (F) is proportional to cerebral pressure (P) and vessel radius (r) and inversely proportional to fluid viscosity (η) and vessel length (l). The purpose of cerebral autoregulation is to ensure continued blood supply to the brain across broad variations in blood pressure, which is achieved by manipulating vascular resistance. Changes in cerebrovascular resistance are also observed with changes in partial pressure of arterial CO2 (PaCO2) [22]. The relationship between PaCO2 and CBF is sigmoidal; when PaCO2 is between ~20 and 60 mm Hg, there is an increase in CBF of ~3–4% for every 1 mm Hg increase in PaCO2. The CBF response is diminished above this PaCO2 range [21, 23, 24]. The increased CBF in response to PaCO2 decreases the concentration of dHb via dilution and robustly increases the BOLD signal, allowing for significant signal detection; there is a relatively large BOLD signal difference (~1–2%) between isocapnic and hypercapnic states, when a moderate level of hypercapnia is induced (~5–8 mm Hg above baseline levels).
There are numerous mechanisms leading to vasodilation. Increased CO2 results in increased carbonic acid in the blood, that leads to hyperpolarization of the smooth muscle cells and vasodilation [2]. CO2 in the blood lowers the pH and changes the muscle tonus of the vessel wall [25]. An increase in CBF is observed following this reduction in pH, which functions to washout the excess CO2 and regulate pH levels. The increased CO2 in the cerebral spinal fluid (CSF) from hypercapnia is known to result in vascular relaxation [26]. Central chemoreceptors located in regions throughout the brainstem, cerebellum, and hypothalamus, which are sensitive to CSF pH, modulate respiratory rate to regulate CO2 levels [27]. Indeed, increasing the fraction of inspired CO2 stimulates the breathing rate to increase, in order to achieve CO2 elimination [28].
End-tidal partial pressure of CO2 (PETCO2) is a close proxy measure of PaCO2 and is therefore used in CVR studies. The total volume of exhaled air is comprised of CO2 within the alveoli and the physiological dead space. Physiological dead space is inhaled air that does not participate in gas exchange and includes non-perfused air within the alveolar and anatomical dead space. Anatomical dead space is the air within the nose, trachea and bronchi that make up the conducting airways. The function of the conducting airways is to channel inhaled air to the respiratory zone where gas exchange occurs; that is, the alveolar surface [29, 30]. In healthy adults, the alveoli dead space is negligible and anatomical dead space comprises all of the non-perfused air. However, excessive air within the alveoli that is not perfused increases the alveoli component of dead space [30]. This excess air within the alveoli typically indicates less efficient CO2 removal and is associated with pulmonary diseases. It will result in a slightly lower (~ ≤ 5 mm Hg) PETCO2 relative to PaCO2 [31], however, this does not preclude PETCO2 from being a robust indicator of PaCO2, and is used in the determination of CVR, calculated as Δ%BOLD/ΔPETCO2 (mm Hg) [2].
Elevated PaCO2 results in a robust vasodilatory response and CBF increase, and therefore, experimental manipulations that increase PETCO2 are used to measure CVR. Breath-holding is one such approach that is low-cost and low-risk. A benefit to the breath-hold approach is that it is more accessible than gas inhalation because it requires less equipment. The monitoring of PETCO2 is highly desirable however, because of variability in the participant breath-hold performance that can be accounted for if measured PETCO2 is included as a statistical regressor in CVR quantification [32]. Comparisons of breath-hold paradigms to CO2 inhalation methods have shown consistent CVR results [33, 34], supporting this method as a reliable technique for calculating CVR. Inhaling gas mixtures containing increased concentrations of CO2 is controllable and more precise than breath holding, and therefore a desirable approach to increasing PaCO2. This is achieved using MRI-compatible breathing circuits that allow for the administration of gas mixtures and the precise recording of PETCO2 [35]. There are different types of breathing circuits available; further information on these can be found in references [2] and [36].
Neural Activity and Bold Signal
Task-based BOLD fMRI reflects neural activity indirectly through NVC [15, 37–40]. NVC is the tightly linked relationship between regional neural activity and changes in blood flow [39]. It is independent of perfusion pressure, and results from the close communications between neurons, glia, and arterioles. The functional hyperemia coupled to neural activity changes ensures that activated neural cells have a constant supply of oxygen and glucose [41]. Arteries commence dilation within hundreds of milliseconds of neuronal activity, and return to baseline within seconds of stimulus termination [14]. The venous side is slower to dilate, taking tens of seconds, and appears to have smaller blood volume changes than the arterial side [42]. There has been a recent wealth of research focussed on describing the roles of specific cell types and their signaling resulting in arteriole dilation [43]. For instance, there is strong evidence for the role of glutamatergic cells in signaling the commencement of arterial dilation. Blood flow increases in conjunction with excitatory pyramidal cell activity have been demonstrated in rodent models [44, 45]. CBF, and to a lesser extent CBV, have been shown to correlate with post-synaptic local field potentials but presynaptic activity does not appear to trigger hemodynamic changes [46]. Astrocytes are important in maintaining basal blood flow [47] and have been implicated in NVC due to their close proximity to both the microvasculature and neurons [48], but how they contribute to NVC remains the topic of debate [47, 49]. An intriguing hypothesis is that endothelial cells in blood vessels can directly detect changes in neural activity, and therefore may be more involved in NVC than previously thought [50–52].
Neural functioning requires a balance of excitation and inhibition, hence recent work has also focused on understanding how inhibitory neurons generate vascular changes. There is evidence from electrophysiology studies demonstrating that gamma power local field potentials, driven by γ-aminobutyric acid (GABA) interneurons, are correlated with hemodynamic changes [53]. GABAergic interneurons are diverse in morphology and physiology, with subtypes characterized by their gene expression and cell innervation [54]. They play an essential role in cortical function by inhibiting excitatory or inhibitory post-synaptic neurons, and while connections remain mostly focal, some GABAergic interneurons extend to the vasculature [55].
Significant progress has been made in understanding the unique role of GABAergic cells in NVC using optogenetic stimulation [56, 57]. Selective photo-stimulation of inhibitory cells can be achieved using a mouse model expressing channelrhodopsin-2 (ChR2) in GABAergic neurons. ChR2 is a light-sensitive cation channel that can induce neuronal depolarization [58]. A study by Vazquez et al. [59] used a ChR2 mouse model and targeted photo-stimulation to selectively activate GABAergic interneurons. Blood flow, volume, and oxygenation increases were observed following photo-stimulation of GABAergic interneurons. Stimulation of certain GABAergic neurons has also resulted in decreases in blood volume in adjacent cortical tissue [60]. This decrease in blood volume is consistent with suggestions that negative BOLD fMRI may reflect neural inhibition [61–63]. Indeed, there is increasing evidence supporting the role of inhibitory neurons in driving NVC and shaping the BOLD response [64]. Some of the work investigating the negative BOLD response is discussed in greater detail the next section.
Hemodynamic Responses to Neural Activity and CO2
The traditional positive BOLD response (PBR) to neural activation is modeled in task-based fMRI using a hemodynamic response function (HRF). The HRF in its canonical form is typically described using the sum of two gamma functions. In gray matter, the time-to-peak is ~6 s from the onset of neural activity, however significant spatial heterogeneity in the shape and timing parameters of HRF has been observed in healthy brains [65, 66] and in different clinical populations [67, 68]. Characterizing temporal HRF parameters may reveal important physiological information not evident from the amplitude of the response alone, which is the main parameter of interest when calculating fMRI activation maps [68, 69]. HRF parameters such as time-to-peak and full-width at half-maximum are influenced by blood flow and NVC, may be important for probing information regarding neuronal duration [70].
Focus has also been placed on understanding negative BOLD responses (NBRs) in task-based fMRI. These responses are identified as stimulus-induced decreases in BOLD signal intensity relative to baseline, or inverted PBRs. Different hypotheses have been suggested to explain the underlying mechanisms of the NBR. One such suggestion is centered on it having purely vascular origins, emerged from research indicating that negative BOLD changes may result from a redistribution (steal) of CBF to adjacent, active cortical regions [71, 72]. Other research has provided conflicting evidence; for instance, NBRs have been identified in brain regions distant from simultaneously occurring PBRs, with these NBR regions having distinct arterial territories [61, 73]. Decreases in neuronal activity accompanying NBRs have suggested a neural origin, with much of the literature supporting this [62, 63, 74–77]. Influential findings from Shmuel et al. [63] demonstrated significant correlations between NBRs and decreases in local field potentials and multiunit activity, measured directly from the primary visual cortex of monkeys. This has been verified in human work using combined electroencephalography (EEG) fMRI, where negative CBF and BOLD changes in NBR regions demonstrate concomitant EEG changes [75, 78]. Although there has been progress made in the attempt to understand the response properties of the NBR [78, 79], further work elucidating how and when NBRs occur and the associated biophysical changes is essential for the accurate interpretation of this signal.
Analyses of BOLD responses to vasoactive stimuli have shown that temporal parameters may reflect important aspects of vascular function in CVR. Typically, CVR mapping considers only the amplitude of the BOLD response to the vasoactive stimulus; however, accounting for temporal variations across the brain may improve CVR estimation accuracy. Identifying temporal variation may also provide novel physiological information. For instance, a slower response may reflect slower vessel dilation due to vascular pathology. The speed of the BOLD response to changes in PETCO2 has shown to reflect pathophysiology in patients with steno-occlusive disease [80]. Slower BOLD responses to CO2 have also been demonstrated in patients with mild cognitive impairment and Alzheimer's Disease (AD) [17]. Analytic approaches to account for temporal delays have been put forth [81–83] and shown to improve CVR mapping in patients with blood flow abnormalities [84].
Neurological Conditions
Abnormal NVC, or even complete uncoupling, can occur when the cascade of events from neuronal activity to functional hyperemia is disrupted. This is known to occur in clinical conditions such as in brain tumors and cerebrovascular disease, and CVR mapping may be effective in improving task-based fMRI interpretation in these instances [85]. The utility of CVR may extend beyond mapping vascular changes to also inform our understanding of cognition. In this section, this argument is made by placing focus on example neurological conditions where CVR, cognitive and task-based fMRI alterations occur. The first two diseases discussed, cerebral small vessel disease and Moyamoya Disease, are characterized by vascular abnormalities. Such vascular-driven diseases are obvious candidates to benefit from CVR mapping. However, the utility of CVR may extend beyond diseases with vascular etiologies, to those that are microstructurally-driven. Therefore, Multiple Sclerosis is discussed in section Multiple Sclerosis.
Cerebral Small Vessel Disease
Cerebral small vessel disease (SVD) refers to a collection of abnormalities affecting the small blood vessels, including the capillaries, arterioles and venules, in the gray and white matter [86]. SVD is strongly associated with advanced age, and has been recognized as a common cause of stroke [87, 88] and dementia [89]. Indeed, SVD is tightly interwoven with AD. Due to the contribution of SVD to AD pathogenesis, the distinction between the two is increasingly blurred [90]. Imaging features of SVD are heterogenous and can present as white matter hyperintensities (WMH), lacunar infarcts, microbleeds, perivascular spaces, and atrophy [88, 91]. SVD types can demonstrate regional preference, for instance, cerebral amyloid angiopathy (CAA) pathology disproportionately affects the occipital cortex. CAA is characterized by the accumulation of amyloid-β predominantly in the arterial walls of the leptomeningeal space and cerebral cortex [92, 93]. SVD types can also be distinguished based on etiology, with sporadic appearances being distinct from those with known genetic etiologies, such as Cerebral Autosomal Dominant Arteriopathy with Subcortical Infarcts and Leukoencephalopathy (CADASIL).
Endothelial dysfunction has been suggested as contributing to the pathogenesis of SVD, resulting in stiff vessels with low reactivity [94, 95]. Concordant results have been reported in studies implementing CO2 challenges to measure CVR in SVD patients. Lower gray matter CVR has been demonstrated in SVD patients [96], and in patients with AD and mild cognitive impairment [97], compared to healthy controls. CVR reductions may show spatial heterogeneity, with AD patients showing reduced anterior (prefrontal, insular, anterior cingulate) CVR [98]. This study also found that the brain regions with reduced CVR did not overlap with regions showing reduced baseline CBF in AD patients, owing to vasoreactivity being sensitive to different pathology than CBF. Lower CVR in both gray and white matter in SVD is positively associated with WMH volume [99], and increases in WMH over time in patients with CADASIL [100]. A systematic literature review was performed by Blair et al. [95], who suggested that the relationship between CVR and WMH is unclear due to inconsistent findings [95]. The authors of this review further suggest that differences in imaging protocols might contribute to these inconsistencies. Another limitation is the lack of research incorporating temporal information into CVR analyses, which has shown to improve CVR estimation and provide important physiological information in patients with SVD [101]. Furthermore, more longitudinal research is warranted, as regions with reduced CVR have shown to precede the appearance of WMH [102].
Cognitive impairment is a common occurrence in patients with SVD. The severity and type of cognitive impairment is highly variable across patients, which may reflect the differences in pathology load and location [103–106]. Cognitive domains frequently impaired in SVD include processing speed and executive function [107], however patients tend to show impaired cognitive abilities across a broad range of domains [108]. This is demonstrated by Table 1, which highlights the range of cognitive impairment observed in SVD. This table summarizes findings from example research studies implementing behavioral assessments to test different cognitive domains in these patients. The studies reported in Table 1 were found using a PubMed search, and search terms included medical subject headings (MeSH) “cerebral small vessel disease,” and each of the assessable cognitive domains [115]. The searched domains were “perception,” “motor skills,” “attention,” “memory,” “executive functioning,” “processing speed,” “language,” and “verbal skills.” When selecting articles for Table 1, preference was given to recently published literature with an age and gender-matched control group.
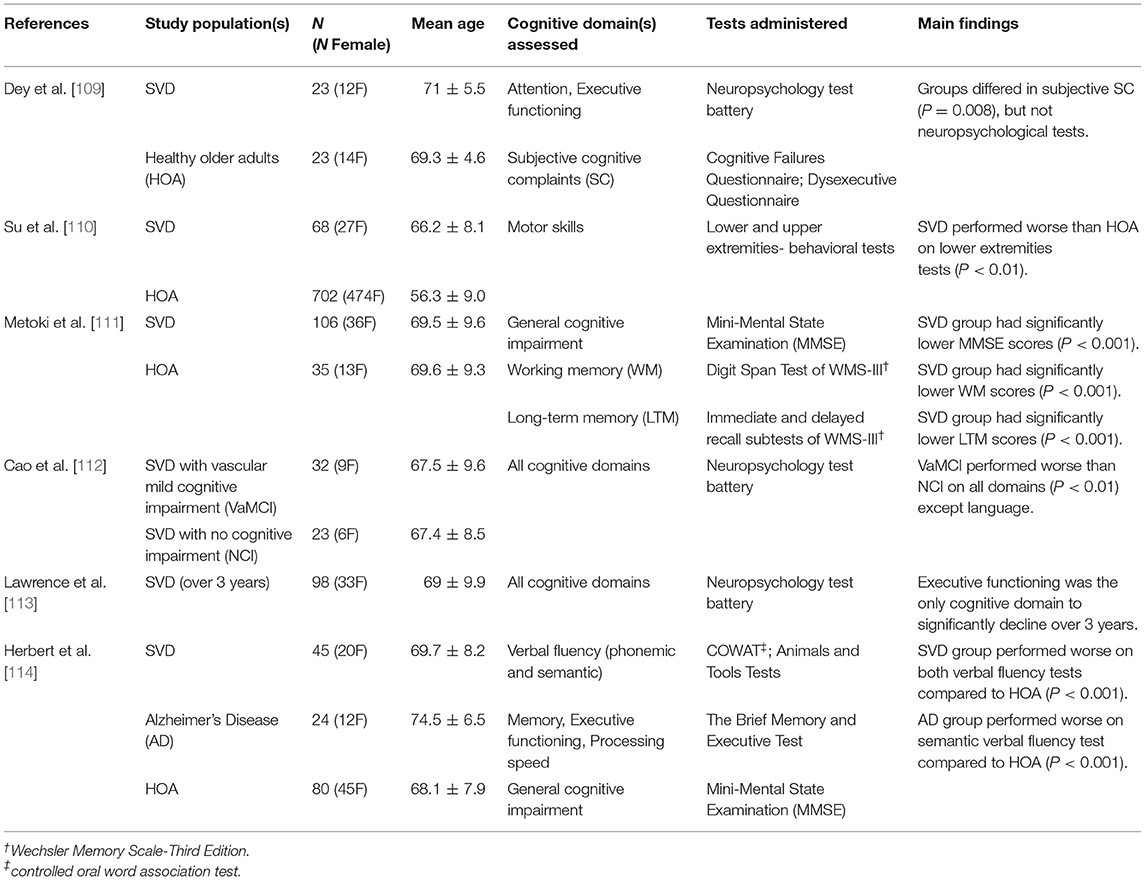
Table 1. Summary of research studies highlighting the cognitive domains impaired in cerebral small vessel disease.
Investigating potential imaging markers of SVD, including its pathogenesis and ongoing physiological changes, is an essential research endeavor [18]. Task-based BOLD fMRI changes in SVD have shown to reflect CVR and cognitive findings, and may potentially provide imaging markers of disease processes. Sensory tasks targeting activity in the visual and motor cortices report reduced BOLD signal amplitude in the visual cortex in patients with CAA [116]. Analysis of the temporal characteristics of these BOLD signal reveals wider and delayed responses in CAA patients compared to aged-matched healthy controls [68]. Longitudinal research has shown that BOLD responses in the occipital cortex of CAA patients decrease over time [117]. These BOLD signal changes may be specific to CAA due to pathology largely affecting the occipital cortex; no such BOLD activation reductions to visual and motor tasks were observed in CADASIL patients [118]. SVD patients have also demonstrated alterations in BOLD activation to cognitive fMRI tasks. Reductions in BOLD signal amplitudes and spatial extent of activation to an attention task have been reported in patients with SVD [119]. This is supported by resting-state fMRI showing reduced frontoparietal connectivity in these patients [120]. Disease processes disrupting neural networks may cause changes in neural activity, reflected by the cognitive and BOLD data. However, vascular abnormalities, as reflected by CVR findings, will also affect task-based BOLD signal in these patients and present a challenge when interpreting BOLD activation maps. When implementing fMRI to investigate SVD imaging markers, CVR may be an important addition to the imaging protocol by providing insight into vascular changes and guide interpretation of fMRI activation.
Moyamoya Disease
Moyamoya disease (MMD) is an idiopathic vasculopathy, characterized by reduced regional cerebral perfusion due to arterial occlusion or stenosis. From the branches of these narrowed arteries, collateral vascular networks form which radiologically appear as a “puff of smoke” (which gave the Japanese name Moyamoya) [121]. Patients with MMD often present with headaches, transient ischemic attacks, and intracranial hemorrhage. Intervention typically involves revascularization surgery. This improves cerebral perfusion to the cerebral vascular territories afflicted, and has shown to have good outcome regarding mortality and quality of life [122].
Comparisons of BOLD CVR to gold-standard CBF mapping using [15O] positron emission tomography [11] and angiography [123] show promising results for CVR in patients with MMD. These findings demonstrate the utility of CVR for assessing which brain regions are afflicted by changes in cerebral perfusion in MMD, and for tracking post-intervention reorganization. Vascular steal is commonly observed in CVR maps in patients with MMD. This phenomenon is observed as negative CVR within brain regions affected by arterial narrowing when a vasoactive stimulus such as CO2 is applied [124]. Negative CVR can be observed in an example patient in Figure 1A below. NBRs in the context of CVR are attributed to the permanently vasodilated state of the affected vessels, which is necessary to ensure sufficient perfusion in the resting baseline state. When PaCO2 increases, these vessels cannot decrease vascular resistance any further to meet this change in demand. Therefore, blood flow is diverted from these regions to brain regions with intact vasodilatory response [126]. Vascular steal in MMD has been associated with increased risk of stroke [127, 128], cortical thinning [129], and increased diffusion in white matter [130]. However, pre-operative appearance of negative CVR has been associated with improved surgical outcome [131]. Negative CVR has shown to resolve following revascularization surgery, representing normalized cerebral perfusion [126, 132].
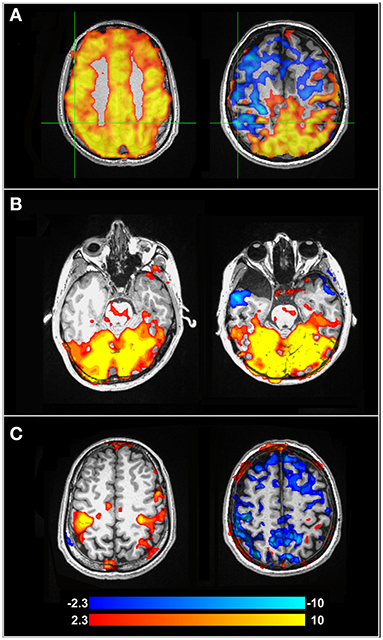
Figure 1. (A) BOLD-CVR maps for a healthy control participant (left) and a pre-surgical patient with MMD (right). Negative CVR in the MMD patient can be observed anteriorly, while the posterior brain is well-preserved. (B) fMRI activation maps from a concurrent visual-motor task, showing robust visual activation for the healthy control (left) and MMD patient (right). (C) Activation maps showing the motor cortex during the same task as (B). The healthy control on the left shows preserved activation, while the motor cortex of the MMD patient (right) shows NBRs due to vascular steal in blue. Further information about the study and experimental protocol used to calculate these maps can be found in Mazerolle et al. [125]. Color bar indicates Z-values.
Cognitive deficits have been described as a common symptom in patients with MMD, with ~30% of patients demonstrating cognitive impairment [133]. Cognitive studies in pre-surgical MMD are summarized in Table 2, where the same search strategy outlined for SVD and Table 1 in section Cerebral Small Vessel Disease above was applied. Cognitive impairment in patients with MMD may be attributed to hypoperfusion [138], as chronic ischemia may cause reduced axon density [139] and decrease cognitive network communication efficiency. While task-based fMRI can be used to clarify neural networks associated with certain cognitive tasks, regional ischemia and perfusion alterations in MMD complicate the ability to identify neural activity through a BOLD response. Mazerolle et al. [140] showed this in pre-operative MMD patients when visual-motor tasks were performed. When patients performed a simultaneous visual-motor task, BOLD activation in the motor cortex of the afflicted hemisphere was not detectable, although prominent activation of the visual cortex was observed. However, when the motor task was performed in isolation (i.e., without concurrent visual stimulation), robust BOLD activation was detected in the afflicted hemisphere. Therefore, the activation of the visual cortex, which had intact CVR, resulted in vascular steal from the MMD-afflicted motor cortex with impaired reactivity. Figures 1B,C highlights altered task-based fMRI activation maps during a concurrent visual-motor task. These results support the necessity of CVR when fMRI is performed in patients with MMD.
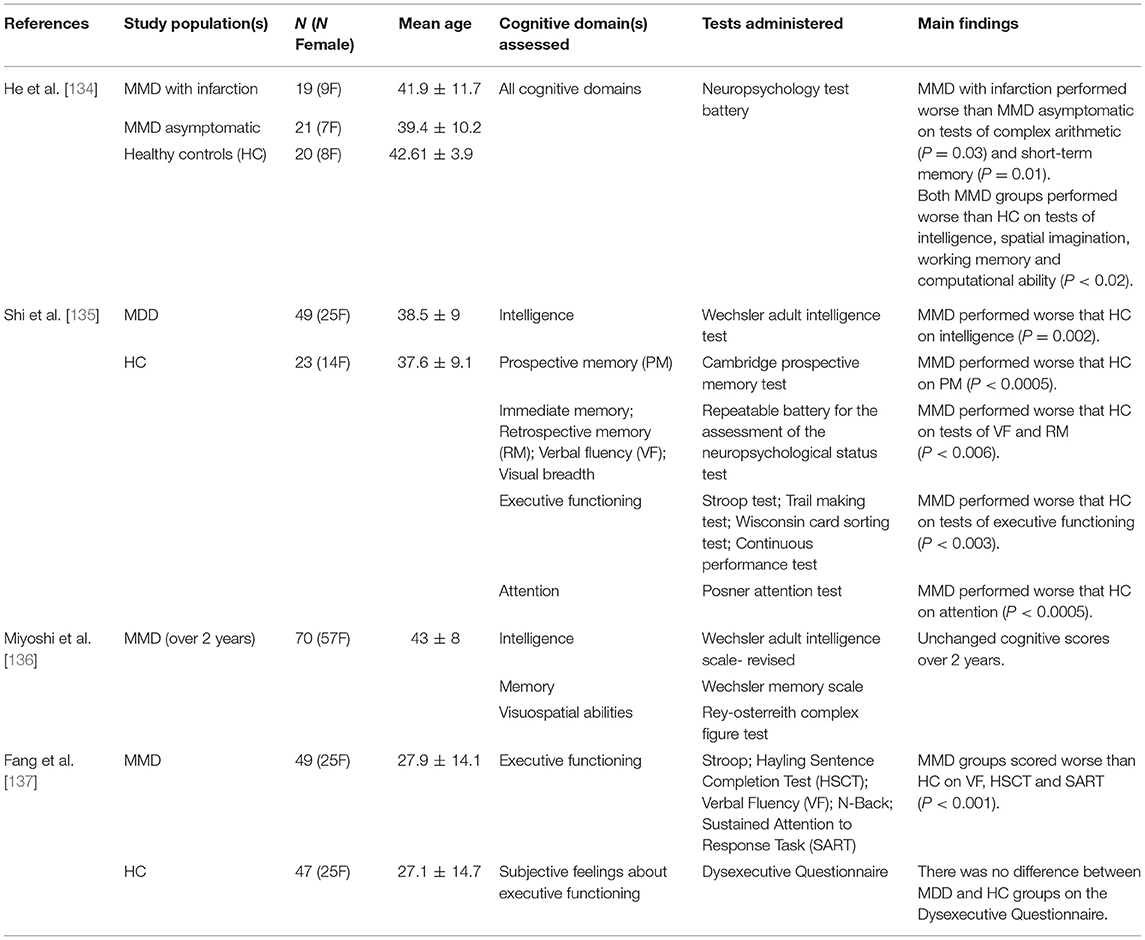
Table 2. Summary of research studies highlighting the cognitive domains impaired in Moyamoya disease.
Multiple Sclerosis
Multiple sclerosis (MS) affects the central nervous system and is characterized by focal regions of demyelination, gliosis, and axonal degeneration. The majority of patients demonstrate a relapsing-remitting (RRMS) form at onset, hallmarked by discrete episodes of neurological impairment followed by periods of remission [141]. Gradual neurodegeneration leads to secondary progressive MS (SPMS), where remission periods subside and continuous progression of the disease occurs. A minority of patients (<10%) have primary progressive MS (PPMS) where the progressive form is evident from onset [142]. MRI indications of MS include multiple lesions dispersed through the white matter, in particular lesions adjacent to the ventricles and cerebral cortex, as assessed with T2-weighted sequences. Lesions may also demonstrate gadolinium enhancement as evidenced on post-contrast T1-weighted images, indicating acute localized breakdown of the blood brain barrier [143]. Even normal-appearing white matter (NAWM) on MRI may be affected by mild inflammation and gliosis in MS, despite these regions largely retaining myelin [144, 145]. While the pathogenesis of MS remains to be fully elucidated, the most widely accepted proposition is that it is an autoimmune disease, with inflammation and neurodegeneration playing a critical role in lesion development and disease progression [146].
Vascular dysfunction has been reported in patients with MS [147]. Studies evaluating CBF have shown hypoperfusion in MS patients relative to healthy controls [148], including regions with NAWM [149]. However, the literature on CVR in MS has provided conflicting results. Findings of decreased CVR in MS patients compared to controls using transcranial Doppler ultrasonography (TCD) [150] has been supported by reported global decreases in gray matter CVR using CBF-sensitized arterial spin labeling (ASL) [151]. However, other studies also using TCD and ASL report no CVR differences between MS patients and controls [152, 153], leading to an inconclusive picture regarding CVR impairment in MS. However, variations in disease severity and cognitive impairment amongst MS patients might underlie these conflicting CVR results. One study reported no significant differences in CVR between MS patients and healthy control groups, but when looking within the patient group only, CVR was significantly reduced in those with cognitive impairment compared to those with intact cognition [154]. Studies pooling subjects in terms of disease course (e.g., RRMS and SPMS) and cognitive impairment may be a contributing factor to the inconsistent CVR findings.
Cognitive decline in MS can be found across all stages of disease progression. As demonstrated by Table 3 (which followed the search criteria outlined in section Cerebral Small Vessel Disease), MS patients have demonstrated impairment across a broad range of cognitive domains. Cognitive decline is not ubiquitous; approximately half of all patients with MS do not exhibit any impairment in cognition [163]. However, the presence of cognitive decline in MS has been associated with reduced BOLD activation during cognitive tasks. Patients with poorer cognitive performance have shown decreased extent of BOLD activation to memory and attention tasks [164, 165]. MS patients with intact task performance have shown additional regions of brain activation compared to healthy controls [166–168]. This association between cognitive performance and BOLD activation in MS has been explained as functional reorganization. In a study comparing MS progression sub-types, Loitfelder et al. showed that the extent of BOLD activation to a processing speed task increased from patients with clinically isolated syndrome, to RRMS, and was most extensive in patients with SPMS [169]. It was reasoned that this was evidence for neuroplasticity changes to increasing tissue damage; more neural networks were required to compensate for those that were damaged by lesions and atrophy. As neural networks become increasingly damaged, communication between network nodes is less efficient. However, communication affecting neuronal activity is not the only breakdown, as the cells governing neurovascular coupling are also damaged. Damage to the neurovascular unit results in insufficient communication between neurons and the vasculature, and unmet nutrient and oxygen requirements [147]. Reduced BOLD response magnitude to cognitive tasks in MS patients may reflect decreased neural activity and/or disrupted NVC, but disentangling these requires more information, such as CVR mapping.
Table 3. Summary of research studies highlighting the cognitive domains impaired in multiple sclerosis.
Normal Physiology
Caffeine
Caffeine is a commonly used ergogenic aid due to it being a psychostimulant of the central nervous system. The most prominent mechanism of action is as an adenosine receptor A1 and A2A antagonist. By blocking the action of inhibitory neurotransmitter adenosine on these receptors, caffeine produces a stimulation effect through disinhibition [170]. It has been long known that adenosine is a regulator of cerebral vasodilation [171]. As an antagonist, caffeine causes a vasoconstrictive effect and reduces CBF [172, 173]. Most studies investigating the neurovascular effects of caffeine consumption administer a dose of 200 mg, which decreases baseline CBF by 30–35% and increases oxygen extraction fraction (OEF) by 15–27% [174–177]. This inverse relationship between CBF and OEF is intuitive, as a reduction in flow would require an increase in OEF to maintain oxygen metabolism rates. But does baseline CMRO2 change after caffeine consumption? The literature is inconsistent. For instance, baseline CMRO2 has been reported as unchanged [177], increased [178] and decreased [176] following caffeine consumption.
The effects of caffeine on CVR appears somewhat more consistent. When characterizing the influence of caffeine on CVR in the motor and visual cortices, one study showed that caffeine increased BOLD-CVR in these regions while having no effect on CBF-CVR [179]. Similarly, Merola et al. [176] reported an increase in BOLD-CVR across the gray matter after caffeine, relative to caffeine-free baseline. Some example CVR maps from individuals who participated in caffeine and caffeine-free placebo conditions are shown in Figure 2. This figure highlights some increased CVR with caffeine, although inter-subject variability is also evident. One interpretation that has been previously linked to increased task-induced BOLD signal changes following caffeine is that a decreased CBF baseline may result in a larger relative BOLD amplitude change [181]. However, further work found that caffeine-induced reductions in resting CBF were not a strong predictor of stimulus-induced BOLD activation [182]. Further research investigating how caffeine influences CVR, and whether this in dependent on factors such as baseline physiology, is therefore warranted.
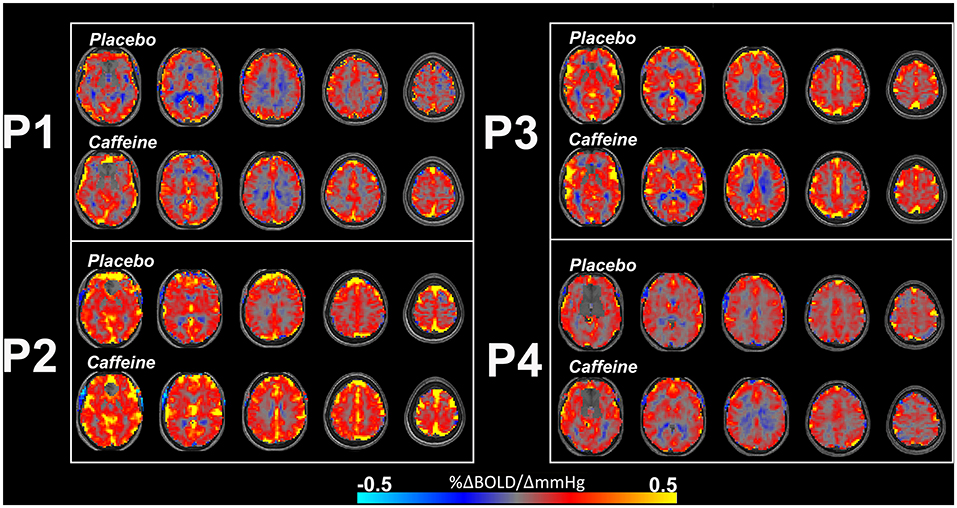
Figure 2. Example BOLD-CVR maps from 4 participants (P1, P2, P3, and P4) who ingested placebo (upper rows) and caffeine (lower rows) pills across two separate scan sessions, 48 h apart. The caffeine condition shows some increased CVR, such as in P1, although there is individual variation and increased CVR is not immediately apparent in every individual. Negative CVR is also evident (in cool colors) in regions close proximity to the ventricles. CVR maps are overlaid on participant's own T1-weighted structural image. Further information about the experimental protocol used to obtain these maps can be found in Specht et al. [180]. Color bar indicates CVR (%ΔBOLD/ΔmmHg).
The cognitive effects of caffeine are well-known and appreciated by frequent consumers. The ingestion of up to 300 mg has shown to enhance alertness, attention, and reaction time performance [183, 184]. How caffeine affects task-induced BOLD signals appears to be dependent on the specific task performed. There is some evidence showing no change to passive visual stimulation-induced BOLD activation following caffeine consumption, despite significantly fewer activated CBF voxels acquired simultaneously [185]. In a different study [186] where a visuo-motor task that required continual alertness to visual cues was implemented, significant BOLD increases with caffeine ingestion were found. These increases corresponded to regions that have been implicated in attention networks, including the basal ganglia, thalamus, putamen and insula. This finding is consistent with other work showing that caffeine increases BOLD activation during a working memory task [187]. This discrepant effect of caffeine on BOLD activation to low-level sensory tasks vs. high-level cognitive tasks was investigated in a single study [188]. This work showed that caffeine reduced BOLD activation in the visual and motor regions to sensory tasks, and consistent with the prior findings outlined above, increased activation in the superior frontal gyrus, paracingulate cortex, and frontal pole to an attention task. An important feature of these research findings is that BOLD modulations to cognitive tasks induced by caffeine may not be replicated in populations with cognitive decline. For instance, a longitudinal study evaluating the effects of caffeine in older adults [189] reported that those who exhibited cognitive decline across time were less sensitive to caffeine-induced BOLD modulations than those showing cognitive stability.
The research discussed here highlights that caffeine modulates both vascular and neural activity, and underscores how the BOLD signal is a complex interplay between these components. As such, task-induced BOLD signal changes following caffeine consumption are highly dependent on the neural networks engaged by the task, and the level of alertness it requires. BOLD-CVR appears to increase following caffeine ingestion; this suggests that changes in task-induced BOLD activation with caffeine may be partly explained by vascular contributions. Further work exploring the link between caffeine-induced changes to CVR and task-based BOLD activation maps is required.
Aging
Healthy aging of the brain includes structural and vascular changes [190]. Evidence for structural changes in healthy older adults includes cortical thinning, with frontal regions appearing to show accelerated rates of thinning with increasing age relative to temporal and occipital regions [191, 192]. Vascular alterations include changes in cerebral microvascular organization and capillary function [193] and indicate a functional decline of the neurovascular unit with age [194, 195]. These alterations at the microvascular level may lead to the changes observed at the macrovascular level. Macrovascular aging is characterized by increased arterial stiffness, corresponding to increased pulse pressure and impaired vascular endothelium function [196], and increased prevalence of hypertension [197]. MRI demonstrates CBF decreases with age [190, 198]. CVR is a useful method for tracking age-related changes to vascular health. Most studies utilizing CVR to investigate aging have focused on age-related diseases; however, important research findings have elucidated CVR changes with disease-free aging to understand how the healthy brain progresses throughout the adult lifespan. In this section, it will be argued that obtaining complementary physiological information such as CVR should be considered a priority for all fMRI investigations in aging populations, especially when comparing to younger adults.
CVR decreases in gray matter have been consistently reported with healthy aging [198–200]. CVR changes with age have also shown spatial heterogeneity. In cross-sectional studies, decreases in CVR within frontal [201] and temporal lobes [202] with increasing age have been reported. To assess CVR changes over time, a longitudinal study by Peng et al. [203] characterized changes over 4 years in participants aged 20–88 years. It was reported that CVR decreased linearly with increasing age across the whole brain, but the temporal lobes showed the fastest rate of decline. The occipital lobes were the most resistant to age-related decline in CVR. However, inter-subject variation was evident in this longitudinal study. Lifestyle factors are likely contributors to variation in CVR. Indeed, exercise and fitness level is positively associated with CVR in healthy older adults [204]. CVR can also reflect cognitive changes with aging. Catchlove et al. [202] showed that CVR in the temporal lobes was associated with memory and attention performance in older adults. Further investigations of healthy brain aging and CVR are required. In particular, it would be important to investigate how the temporal characteristics of the CVR response relate to cognitive changes with aging.
Task-based fMRI studies have shown BOLD activation decreases with increasing age during tasks of visual attention [205, 206], working memory [207, 208] and memory encoding [209, 210], as would be expected if such cognitive functioning decreases with age. However, neural activity-mediated BOLD changes with age also show significant heterogeneity. One meta-analysis reported decreased prefrontal cortex activation in older adults during working memory tasks, while other task-engaged regions including the cingulate and parietal cortex remained unaffected throughout adulthood [207]. Other studies reveal conflicting findings by showing increased frontal lobe activation in older adults compared to younger cohorts during working memory tasks [211–213]. These inconsistent findings reflect increased variability in fMRI activation patterns in the older groups.
Two example patterns of age-related changes to BOLD activation that have been reported in the literature are hemispheric asymmetry reduction, and posterior-to-anterior shift. The first describes a shift in BOLD activation to cognitive tasks from unilateral to bilateral with increasing age [214–216]. That is, older adults more often recruit both cerebral hemispheres for tasks that show unilateral engagement in younger adults. The recruitment of both hemispheres in older adults has been associated with better task performance, and has been suggested to be a compensatory mechanism [217]. The second pattern, the posterior-to-anterior shift, describes findings of decreased activation in the occipital and temporal regions, and increase frontal activation during a variety of cognitive tasks, and this is also hypothesized to reflect compensatory mechanisms [218]. As outlined above, CVR also decreases with age, thus complicating the interpretation of task-based BOLD activation shifts. This is illustrated in Figure 3. Gauthier et al. exemplified these interpretation challenges by demonstrating that groups of older and younger adults showed similar BOLD activations to the Stroop task (i.e., executive functioning), however, CVR was reduced in the older group [219]. This demonstrates that BOLD activations to cognitive tasks cannot be directly compared between groups of different ages, as underling metabolic activity cannot be inferred from BOLD activation maps alone. Similar BOLD activation profiles between the older and younger adults in the context of reduced CVR means that metabolic activity was likely different between the groups [220]. Overall, the complex neurobiological and heterogenous changes that occur with age are reflected in the highly variable and inconsistent task-based BOLD findings in the literature.

Figure 3. Compared to younger adults, older subjects have shown decreased BOLD responses posteriorly, and increased responses anteriorly. This has been hypothesized to reflect a neural compensation mechanism; however, the underlying neural activity is difficult to interpret from BOLD fMRI alone. Insets (A,B) depict two possible scenarios that would cause task-induced BOLD reductions and are not due to decreased neural activity. Reduced BOLD activation can occur in the context of intact neurovascular coupling but reduced CVR, as shown in (A). In this circumstance, the decline in activation may be due to reduced CVR only, with neural activity spared. An alternative situation is presented in (B), where reduced posterior BOLD activation is due to altered neurovascular coupling (illustrated as less connection between the neuron and astrocyte). Here, neural activity may still be intact but there is a communication breakdown between neurons and the vasculature, including glial cells governing the vascular response. This inset highlights that reduced task-induced BOLD activation may be accompanied by CVR maps showing intact CVR in this situation. Inset (C) illustrates robust BOLD responses and CVR to neural activity, as would be expected in healthy brain tissue. While this healthy activation may appear as increased neural activity compared to the posterior brain, this figure highlights how care needs to be taken in this interpretation.
Integration of Bold-Based Assessments of CVR and Neural Activity: Hypercapnic Normalization
This review paper has emphasized that adding CVR to task-based fMRI protocols may improve interpretation of BOLD activation maps. One analytical approach that integrates CVR is using it to correct activation maps through hypercapnic normalization. This was initially suggested by Bandettini and Wong [221] as a way to minimize signal contributions from large blood vessels. The premise of this work was that BOLD signal magnitude is highly weighted by baseline cerebral blood volume (CBV). They noted that a very large BOLD signal change of 15% would be observed in a voxel with 20% CBV, compared to a moderate 2.5% signal change in a voxel with 5% CBV, assuming all other parameters are identical. Removing this activation bias from voxels with higher CBV might be achieved using hypercapnia-induced BOLD signal changes. The authors suggested that hypercapnia induces consistent venous oxygenation changes across the brain, and any spatial variation in BOLD intensity would presumably be due to resting CBV and vessel size. The division of activation-induced signal change by hypercapnia BOLD signal change would return a normalized task-induced activation map void of influences from large vessels. This was investigated using a hypercapnia stimulus where subjects inhaled a 5% CO2 gas mixture, and performed a motor task. The peak activation observed in the motor task prior to normalization was in the sagittal sinus; after normalization the peak signal shifted to the brain parenchyma and therefore improved spatial specificity toward neuronal function.
This work was followed up by Cohen et al. [222] who investigated the effects of magnetic field strength on hypercapnic normalization. Similar to Bandettini and Wong [221], a motor task and 5% CO2 hypercapnia stimulation was implemented. At a magnetic field strength of 4 T, the findings were consistent with Bandettini and Wong [221], where voxels containing large vessels were highly activated by the motor task but showed low normalized BOLD signal. Furthermore, these voxels were located in regions distant to the site of neural activity. At 7 T, the effect of hypercapnic normalization was less apparent due to the expected increased sensitivity to smaller blood vessels at this higher field strength. Research studies following Cohen et al. [222] capitalized on hypercapnic normalization to improve signal specificity. The breath-hold hypercapnia approach for increasing CBF was implemented to normalize BOLD-activation to a motor task [223] and a working memory task [224]. These studies found that hypercapnic normalization reduced the influence of vascular variability between subjects. A study by Handwerker et al. [20] implemented hypercapnic normalization to reduce vascular variability in task-induced BOLD signal in order to improve group comparisons between older and younger adults. Normalization removed age-related differences in some of the regions of interest, in particular those in frontal brain regions. A strong linear relationship between task-induced and hypercapnia BOLD signal was found and the authors suggested that hypercapnia response variability accounts for a large amount of the BOLD signal variability observed during the task. However, inter-subject variation increased in the older group after hypercapnic normalization, in contrast to the findings of Thomason et al. [224] and Biswal et al. [223].
These conflicting findings were examined in detail by Liau et al. [225]. To address inter-subject variability, their study investigated different approaches to hypercapnic normalization. The first method utilized a voxel-wise approach where the task-induced BOLD response for each voxel is divided by the hypercapnic BOLD response from the corresponding voxel. The second method was also a division tactic but used each subject's averaged hypercapnia BOLD responses within ROIs, rather than a voxel-wise implementation. The selection of ROIs was based on voxels demonstrating significant task and hypercapnic BOLD activation. A third method shifted from the division tactic and modeled hypercapnic BOLD responses as covariates. The covariate-normalized approach fit the task-induced BOLD response amplitudes to linear regression models where the hypercapnic BOLD responses were regressors. The amplitudes of the task-induced signals were then normalized by the slope of the regression lines. The authors found that the covariate-normalized approach demonstrated reduced inter-subject variability compared to the division methods.
The inclusion of CVR information into task-based fMRI has shown to improve comparisons between older and younger adults in a memory encoding task [226]. This study showed that the two age groups had more comparable activation maps after hypercapnic normalization. Similar findings were reported in a study comparing adults with different fitness levels [227]. These comparisons would have been otherwise confounded by vascular changes without the information given by CVR. Overall, hypercapnic normalization has strong potential for addressing intrinsic limitations of BOLD fMRI.
Conclusion
Few studies exist that use CVR to inform interpretation of task-based BOLD activation. However, it is becoming increasingly clear that changes in CVR, cognition, and task-induced BOLD activation are highly interrelated. This is evident in patients with neurological conditions, both vascular and microstructurally-driven; and in normal physiology following caffeine consumption, and in healthy brain aging. These are just a few examples discussed here and not a comprehensive list. Correction procedures such as hypercapnic normalization can be performed to correct task-based BOLD activation by CVR, although further research into this and other image integration approaches is warranted.
Author Contributions
RW and GP conceived the idea and wrote the manuscript, and completed Figures 2, 3 with MM. MM and EM shaped and edited the manuscript. EM analyzed the data from and completed Figure 1. All authors contributed to the article and approved the submitted version.
Funding
Financial support from the Canadian Institutes for Health Research (CIHR FDN-143290), the Natural Science and Engineering Research Council (NSERC RGPIN-2017-03880), and the Campus Alberta Innovation Program (CAIP) are acknowledged (GBP).
Conflict of Interest
The authors declare that the research was conducted in the absence of any commercial or financial relationships that could be construed as a potential conflict of interest.
References
1. Fisher JA, Venkatraghavan L, Mikulis DJ. Magnetic resonance imaging-based cerebrovascular reactivity and hemodynamic reserve. Stroke. (2018) 49:2011–8. doi: 10.1161/STROKEAHA.118.021012
2. Liu P, De Vis JB, Lu H. Cerebrovascular reactivity (CVR) MRI with CO2 challenge: A technical review. Neuroimage. (2019) 187:104–15. doi: 10.1016/j.neuroimage.2018.03.047
3. Kim SG, Ogawa S. Biophysical and physiological origins of blood oxygenation level-dependent fMRI signals. J Cereb Blood Flow Metab. (2012) 32:1188–206. doi: 10.1038/jcbfm.2012.23
4. Hoge RD, Atkinson J, Gill B, Crelier GR, Marrett S, Pike GB. Investigation of BOLD signal dependence on cerebral blood flow and oxygen consumption: the deoxyhemoglobin dilution model. Magn Reson Med. (1999) 42:849–63. doi: 10.1002/(SICI)1522-2594(199911)42:5<849::AID-MRM4>3.0.CO;2-Z
5. Jain V, Langham MC, Floyd TF, Jain G, Magland JF, Wehrli FW. Rapid magnetic resonance measurement of global cerebral metabolic rate of oxygen consumption in humans during rest and hypercapnia. J Cereb Blood Flow Metab. (2011) 31:1504–12. doi: 10.1038/jcbfm.2011.34
6. Chen JJ, Pike GB. Global cerebral oxidative metabolism during hypercapnia and hypocapnia in humans: implications for BOLD fMRI. J Cereb Blood Flow Metab. (2010) 30:1094–9. doi: 10.1038/jcbfm.2010.42
7. Mandell DM, Han JS, Poublanc J, Crawley AP, Stainsby JA, Fisher JA, et al. Mapping cerebrovascular reactivity using blood oxygen level-dependent MRI in Patients with arterial steno-occlusive disease: comparison with arterial spin labeling MRI. Stroke. (2008) 39:2021–8. doi: 10.1161/STROKEAHA.107.506709
8. MacDonald ME, Frayne R. Cerebrovascular MRI: a review of state-of-the-art approaches, methods and techniques. NMR Biomed. (2015) 28:767–91. doi: 10.1002/nbm.3322
9. Foster C, Steventon JJ, Helme D, Tomassini V, Wise RG. Assessment of the effects of aerobic fitness on cerebrovascular function in young adults using multiple inversion time arterial spin labeling MRI. Front Physiol. (2020) 11:360. doi: 10.3389/fphys.2020.00360
10. Robba C, Cardim D, Sekhon M, Budohoski K, Czosnyka M. Transcranial Doppler: a stethoscope for the brain-neurocritical care use. J Neurosci Res. (2018) 96:720–30. doi: 10.1002/jnr.24148
11. Hauser TK, Seeger A, Bender B, Klose U, Thurow J, Ernemann U, et al. Hypercapnic BOLD MRI compared to O PET/CT for the hemodynamic evaluation of patients with Moyamoya disease. Neuroimage Clin. (2019) 22:101713. doi: 10.1016/j.nicl.2019.101713
12. Fan AP, Jahanian H, Holdsworth SJ, Zaharchuk G. Comparison of cerebral blood flow measurement with [15O]-water positron emission tomography and arterial spin labeling magnetic resonance imaging: a systematic review. J Cereb Blood Flow Metab. (2016) 36:842–61. doi: 10.1177/0271678X16636393
13. Kassner A, Winter JD, Poublanc J, Mikulis DJ, Crawley AP. Blood-oxygen level dependent MRI measures of cerebrovascular reactivity using a controlled respiratory challenge: reproducibility and gender differences. J Magn Reson Imaging. (2010) 31:298–304. doi: 10.1002/jmri.22044
14. Drew PJ. Vascular and neural basis of the BOLD signal. Curr Opin Neurobiol. (2019) 58:61–9. doi: 10.1016/j.conb.2019.06.004
15. Mark CI, Mazerolle EL, Chen JJ. Metabolic and vascular origins of the BOLD effect: Implications for imaging pathology and resting-state brain function. J Magn Reson Imaging JMRI. (2015) 42:231–46. doi: 10.1002/jmri.24786
16. Hoge RD, Atkinson J, Gill B, Crelier GR, Marrett S, Pike GB. Linear coupling between cerebral blood flow and oxygen consumption in activated human cortex. Proc Natl Acad Sci USA. (1999) 96:9403–8. doi: 10.1073/pnas.96.16.9403
17. Richiardi J, Monsch AU, Haas T, Barkhof F, Van de Ville D, Radü EW, et al. Altered cerebrovascular reactivity velocity in mild cognitive impairment and Alzheimer's disease. Neurobiol Aging. (2015) 36:33–41. doi: 10.1016/j.neurobiolaging.2014.07.020
18. Smith EE, Beaudin AE. New insights into cerebral small vessel disease and vascular cognitive impairment from MRI. Curr Opin Neurol. (2018) 31:36–43. doi: 10.1097/WCO.0000000000000513
19. Catchlove SJ, Pipingas A, Hughes ME, Macpherson H. Magnetic resonance imaging for assessment of cerebrovascular reactivity and its relationship to cognition: a systematic review. BMC Neurosci. (2018) 19:21. doi: 10.1186/s12868-018-0421-4
20. Handwerker DA, Gazzaley A, Inglis BA, D'Esposito M. Reducing vascular variability of fMRI data across aging populations using a breathholding task. Hum Brain Mapp. (2007) 28:846–59. doi: 10.1002/hbm.20307
21. Willie CK, Tzeng YC, Fisher JA, Ainslie PN. Integrative regulation of human brain blood flow. J Physiol. (2014) 592:841–59. doi: 10.1113/jphysiol.2013.268953
22. Battisti-Charbonney A, Fisher J, Duffin J. The cerebrovascular response to carbon dioxide in humans. J Physiol. (2011) 589(Pt 12):3039–48. doi: 10.1113/jphysiol.2011.206052
23. Ainslie PN, Duffin J. Integration of cerebrovascular CO2 reactivity and chemoreflex control of breathing: mechanisms of regulation, measurement, and interpretation. Am J Physiol Regul Integr Comp Physiol. (2009) 296:R1473–95. doi: 10.1152/ajpregu.91008.2008
24. Brugniaux JV, Hodges AN, Hanly PJ, Poulin MJ. Cerebrovascular responses to altitude. Respir Physiol Neurobiol. (2007) 158:212–23. doi: 10.1016/j.resp.2007.04.008
25. Ogoh S. Interaction between the respiratory system and cerebral blood flow regulation. J Appl Physiol. (2019) 127:1197–205. doi: 10.1152/japplphysiol.00057.2019
26. Yoon S, Zuccarello M, Rapoport RM. pCO(2) and pH regulation of cerebral blood flow. Front Physiol. (2012) 3:365. doi: 10.3389/fphys.2012.00365
27. Nattie E, Li A. Central chemoreceptors: locations and functions. Compr Physiol. (2012) 2:221–54. doi: 10.1002/cphy.c100083
28. Crocker GH, Toth B, Jones JH. Combined effects of inspired oxygen, carbon dioxide, and carbon monoxide on oxygen transport and aerobic capacity. J Appl Physiol. (2013) 115:643–52. doi: 10.1152/japplphysiol.01407.2012
29. Tymko MM, Hoiland RL, Kuca T, Boulet LM, Tremblay JC, Pinske BK, et al. Measuring the human ventilatory and cerebral blood flow response to CO2: a technical consideration for the end-tidal-to-arterial gas gradient. J Appl Physiol. (2016) 120:282–96. doi: 10.1152/japplphysiol.00787.2015
30. Powell FL, Wagner PD, West JB. Ventilation, blood flow and gas exchange. In: Broaddus CV, Mason RC, Ernst JD, King Jr TE, Lazarus SC, Murray JF, et al. editors. Murray and Nadel's Textbook of Respiratory Medicine. 6th ed. Philadelphia, PA: Elsevier (2016). p. 44–75.e3. doi: 10.1016/B978-1-4557-3383-5.00004-X
31. Petersson J, Glenny RW. Gas exchange and ventilation-perfusion relationships in the lung. Eur Respir J. (2014) 44:1023–41. doi: 10.1183/09031936.00037014
32. Bright MG, Murphy K. Reliable quantification of BOLD fMRI cerebrovascular reactivity despite poor breath-hold performance. Neuroimage. (2013) 83:559–68. doi: 10.1016/j.neuroimage.2013.07.007
33. Tancredi FB, Hoge RD. Comparison of cerebral vascular reactivity measures obtained using breath-holding and CO2 inhalation. J Cereb Blood Flow Metab. (2013) 33:1066–74. doi: 10.1038/jcbfm.2013.48
34. Kastrup A, Krüger G, Neumann-Haefelin T, Moseley ME. Assessment of cerebrovascular reactivity with functional magnetic resonance imaging: comparison of CO(2) and breath holding. Magn Reson Imaging. (2001) 19:13–20. doi: 10.1016/S0730-725X(01)00227-2
35. Tancredi FB, Lajoie I, Hoge RD. A simple breathing circuit allowing precise control of inspiratory gases for experimental respiratory manipulations. BMC Res Notes. (2014) 7:235. doi: 10.1186/1756-0500-7-235
36. Fisher JA. The CO2 stimulus for cerebrovascular reactivity: fixing inspired concentrations vs. targeting end-tidal partial pressures. J Cereb Blood Flow Metab. (2016) 36:1004–11. doi: 10.1177/0271678X16639326
37. Logothetis NK, Pauls J, Augath M, Trinath T, Oeltermann A. Neurophysiological investigation of the basis of the fMRI signal. Nature. (2001) 412:150–7. doi: 10.1038/35084005
38. Logothetis NK. The neural basis of the blood-oxygen-level-dependent functional magnetic resonance imaging signal. Philos Trans R Soc Lond B Biol Sci. (2002) 357:1003–37. doi: 10.1098/rstb.2002.1114
39. Hillman EM. Coupling mechanism and significance of the BOLD signal: a status report. Annu Rev Neurosci. (2014) 37:161–81. doi: 10.1146/annurev-neuro-071013-014111
40. Gauthier CJ, Fan AP. BOLD signal physiology: models and applications. Neuroimage. (2019) 187:116–27. doi: 10.1016/j.neuroimage.2018.03.018
41. Filosa JA, Morrison HW, Iddings JA, Du W, Kim KJ. Beyond neurovascular coupling, role of astrocytes in the regulation of vascular tone. Neuroscience. (2016) 323:96–109. doi: 10.1016/j.neuroscience.2015.03.064
42. Kim T, Kim SG. Cortical layer-dependent arterial blood volume changes: improved spatial specificity relative to BOLD fMRI. Neuroimage. (2010) 49:1340–9. doi: 10.1016/j.neuroimage.2009.09.061
43. Iadecola C. The neurovascular unit coming of age: a journey through neurovascular coupling in health and disease. Neuron. (2017) 96:17–42. doi: 10.1016/j.neuron.2017.07.030
44. Lecrux C, Toussay X, Kocharyan A, Fernandes P, Neupane S, Lévesque M, et al. Pyramidal neurons are “neurogenic hubs” in the neurovascular coupling response to whisker stimulation. J Neurosci. (2011) 31:9836–47. doi: 10.1523/JNEUROSCI.4943-10.2011
45. Lee JH, Durand R, Gradinaru V, Zhang F, Goshen I, Kim DS, et al. Global and local fMRI signals driven by neurons defined optogenetically by type and wiring. Nature. (2010) 465:788–92. doi: 10.1038/nature09108
46. Iordanova B, Vazquez AL, Poplawsky AJ, Fukuda M, Kim SG. Neural and hemodynamic responses to optogenetic and sensory stimulation in the rat somatosensory cortex. J Cereb Blood Flow Metab. (2015) 35:922–32. doi: 10.1038/jcbfm.2015.10
47. Rosenegger DG, Tran CH, Wamsteeker Cusulin JI, Gordon GR. Tonic local brain blood flow control by astrocytes independent of phasic neurovascular coupling. J Neurosci. (2015) 35:13463–74. doi: 10.1523/JNEUROSCI.1780-15.2015
48. Muñoz MF, Puebla M, Figueroa XF. Control of the neurovascular coupling by nitric oxide-dependent regulation of astrocytic Ca(2+) signaling. Front Cell Neurosci. (2015) 9:59. doi: 10.3389/fncel.2015.00059
49. Mishra A, Reynolds JP, Chen Y, Gourine AV, Rusakov DA, Attwell D. Astrocytes mediate neurovascular signaling to capillary pericytes but not to arterioles. Nat Neurosci. (2016) 19:1619–27. doi: 10.1038/nn.4428
50. Chen BR, Kozberg MG, Bouchard MB, Shaik MA, Hillman EM. A critical role for the vascular endothelium in functional neurovascular coupling in the brain. J Am Heart Assoc. (2014) 3:e000787. doi: 10.1161/JAHA.114.000787
51. Longden TA, Dabertrand F, Koide M, Gonzales AL, Tykocki NR, Brayden JE, et al. Capillary K+ sensing initiates retrograde hyperpolarization to increase local cerebral blood flow. Nat Neurosci. (2017) 20:717–26. doi: 10.1038/nn.4533
52. Hogan-Cann AD, Lu P, Anderson CM. Endothelial NMDA receptors mediate activity-dependent brain hemodynamic responses in mice. Proc Natl Acad Sci USA. (2019) 116:10229–31. doi: 10.1073/pnas.1902647116
53. Lecrux C, Hamel E. Neuronal networks and mediators of cortical neurovascular coupling responses in normal and altered brain states. Philos Trans R Soc Lond B Biol Sci. (2016) 371:20150350. doi: 10.1098/rstb.2015.0350
54. Taniguchi H. Genetic dissection of GABAergic neural circuits in mouse neocortex. Front Cell Neurosci. (2014) 8:8. doi: 10.3389/fncel.2014.00008
55. Cauli B, Hamel E. Revisiting the role of neurons in neurovascular coupling. Front Neuroenergetics. (2010) 2:9. doi: 10.3389/fnene.2010.00009
56. Anenberg E, Chan AW, Xie Y, LeDue JM, Murphy TH. Optogenetic stimulation of GABA neurons can decrease local neuronal activity while increasing cortical blood flow. J Cereb Blood Flow Metab. (2015) 35:1579–86. doi: 10.1038/jcbfm.2015.140
57. Uhlirova H, Kiliç K, Tian P, Thunemann M, Desjardins M, Saisan PA, et al. Cell type specificity of neurovascular coupling in cerebral cortex. Elife. (2016) 5:e14315. doi: 10.7554/eLife.14315
58. Britt JP, McDevitt RA, Bonci A. Use of channelrhodopsin for activation of CNS neurons. Curr Protoc Neurosci. (2012). 2:1–19. doi: 10.1002/0471142301.ns0216s58
59. Vazquez AL, Fukuda M, Kim SG. Inhibitory neuron activity contributions to hemodynamic responses and metabolic load examined using an inhibitory optogenetic mouse model. Cereb Cortex. (2018) 28:4105–19. doi: 10.1093/cercor/bhy225
60. Lee L, Boorman L, Glendenning E, Christmas C, Sharp P, Redgrave P, et al. Key aspects of neurovascular control mediated by specific populations of inhibitory cortical interneurons. Cereb Cortex. (2020) 30:2452–64. doi: 10.1093/cercor/bhz251
61. Stefanovic B, Warnking JM, Pike GB. Hemodynamic and metabolic responses to neuronal inhibition. NeuroImage. (2004) 22:771–8. doi: 10.1016/j.neuroimage.2004.01.036
62. Sten S, Lundengård K, Witt ST, Cedersund G, Elinder F, Engström M. Neural inhibition can explain negative BOLD responses: a mechanistic modelling and fMRI study. Neuroimage. (2017) 158:219–31. doi: 10.1016/j.neuroimage.2017.07.002
63. Shmuel A, Augath M, Oeltermann A, Logothetis NK. Negative functional MRI response correlates with decreases in neuronal activity in monkey visual area V1. Nat Neurosci. (2006) 9:569–77. doi: 10.1038/nn1675
64. Aksenov DP, Li L, Miller MJ, Wyrwicz AM. Role of the inhibitory system in shaping the BOLD fMRI response. Neuroimage. (2019) 201:116034. doi: 10.1016/j.neuroimage.2019.116034
65. West KL, Zuppichini MD, Turner MP, Sivakolundu DK, Zhao Y, Abdelkarim D, et al. BOLD hemodynamic response function changes significantly with healthy aging. Neuroimage. (2019) 188:198–207. doi: 10.1016/j.neuroimage.2018.12.012
66. Handwerker DA, Ollinger JM, D'Esposito M. Variation of BOLD hemodynamic responses across subjects and brain regions and their effects on statistical analyses. NeuroImage. (2004) 21:1639–51. doi: 10.1016/j.neuroimage.2003.11.029
67. Beers CA, Williams RJ, Gaxiola-Valdez I, Pittman DJ, Kang AT, Aghakhani Y, et al. Patient specific hemodynamic response functions associated with interictal discharges recorded via simultaneous intracranial EEG-fMRI. Hum Brain Mapp. (2015) 36:5252–64. doi: 10.1002/hbm.23008
68. Williams RJ, Goodyear BG, Peca S, McCreary CR, Frayne R, Smith EE, et al. Identification of neurovascular changes associated with cerebral amyloid angiopathy from subject-specific hemodynamic response functions. J Cereb Blood Flow Metab. (2017) 37:3433–45. doi: 10.1177/0271678X17691056
69. Williams RJ, McMahon KL, Hocking J, Reutens DC. Comparison of block and event-related experimental designs in diffusion-weighted functional MRI. J Magn Reson Imaging JMRI. (2014) 40:367–75. doi: 10.1002/jmri.24353
70. Lindquist MA, Meng Loh J, Atlas LY, Wager TD. Modeling the hemodynamic response function in fMRI: efficiency, bias and mis-modeling. NeuroImage. (2009) 45(Suppl. 1):S187–98. doi: 10.1016/j.neuroimage.2008.10.065
71. Harel N, Lee SP, Nagaoka T, Kim DS, Kim SG. Origin of negative blood oxygenation level-dependent fMRI signals. J Cereb Blood Flow Metab. (2002) 22:908–17. doi: 10.1097/00004647-200208000-00002
72. Hu D, Huang L. Negative hemodynamic response in the cortex: evidence opposing neuronal deactivation revealed via optical imaging and electrophysiological recording. J Neurophysiol. (2015) 114:2152–61. doi: 10.1152/jn.00246.2015
73. Liu Y, Shen H, Zhou Z, Hu D. Sustained negative BOLD response in human fMRI finger tapping task. PLoS ONE. (2011) 6:e23839. doi: 10.1371/journal.pone.0023839
74. Boorman L, Harris S, Bruyns-Haylett M, Kennerley A, Zheng Y, Martin C, et al. Long-latency reductions in gamma power predict hemodynamic changes that underlie the negative BOLD signal. J Neurosci. (2015) 35:4641–56. doi: 10.1523/JNEUROSCI.2339-14.2015
75. Mullinger KJ, Mayhew SD, Bagshaw AP, Bowtell R, Francis ST. Evidence that the negative BOLD response is neuronal in origin: a simultaneous EEG-BOLD-CBF study in humans. NeuroImage. (2014) 94:263–74. doi: 10.1016/j.neuroimage.2014.02.029
76. Huber L, Goense J, Kennerley AJ, Ivanov D, Krieger SN, Lepsien J, et al. Investigation of the neurovascular coupling in positive and negative BOLD responses in human brain at 7 T. NeuroImage. (2014) 97:349–62. doi: 10.1016/j.neuroimage.2014.04.022
77. Shmuel A, Yacoub E, Pfeuffer J, Van de Moortele PF, Adriany G, Hu X, et al. Sustained negative BOLD, blood flow and oxygen consumption response and its coupling to the positive response in the human brain. Neuron. (2002) 36:1195–210. doi: 10.1016/S0896-6273(02)01061-9
78. Wilson R, Mullinger KJ, Francis ST, Mayhew SD. The relationship between negative BOLD responses and ERS and ERD of alpha/beta oscillations in visual and motor cortex. Neuroimage. (2019) 199:635–50. doi: 10.1016/j.neuroimage.2019.06.009
79. Wilson R, Thomas A, Mayhew SD. Spatially congruent negative BOLD responses to different stimuli do not summate in visual cortex. Neuroimage. (2020) 218:116891. doi: 10.1016/j.neuroimage.2020.116891
80. Poublanc J, Crawley AP, Sobczyk O, Montandon G, Sam K, Mandell DM, et al. Measuring cerebrovascular reactivity: the dynamic response to a step hypercapnic stimulus. J Cereb Blood Flow Metab. (2015) 35:1746–56. doi: 10.1038/jcbfm.2015.114
81. Duffin J, Sobczyk O, Crawley AP, Poublanc J, Mikulis DJ, Fisher JA. The dynamics of cerebrovascular reactivity shown with transfer function analysis. Neuroimage. (2015) 114:207–16. doi: 10.1016/j.neuroimage.2015.04.029
82. van Niftrik CHB, Piccirelli M, Bozinov O, Pangalu A, Fisher JA, Valavanis A, et al. Iterative analysis of cerebrovascular reactivity dynamic response by temporal decomposition. Brain Behav. (2017) 7:e00705. doi: 10.1002/brb3.705
83. Fisher JA, Sobczyk O, Crawley A, Poublanc J, Dufort P, Venkatraghavan L, et al. Assessing cerebrovascular reactivity by the pattern of response to progressive hypercapnia. Hum Brain Mapp. (2017) 38:3415–27. doi: 10.1002/hbm.23598
84. Leung J, Duffin J, Fisher JA, Kassner A. MRI-based cerebrovascular reactivity using transfer function analysis reveals temporal group differences between patients with sickle cell disease and healthy controls. Neuroimage Clin. (2016) 12:624–30. doi: 10.1016/j.nicl.2016.09.009
85. Pillai JJ, Mikulis DJ. Cerebrovascular reactivity mapping: an evolving standard for clinical functional imaging. AJNR Am J Neuroradiol. (2015) 36:7–13. doi: 10.3174/ajnr.A3941
87. Ter Telgte A, van Leijsen EMC, Wiegertjes K, Klijn CJM, Tuladhar AM, de Leeuw FE. Cerebral small vessel disease: from a focal to a global perspective. Nat Rev Neurol. (2018) 14:387–98. doi: 10.1038/s41582-018-0014-y
88. Wardlaw JM, Smith EE, Biessels GJ, Cordonnier C, Fazekas F, Frayne R, et al. Neuroimaging standards for research into small vessel disease and its contribution to ageing and neurodegeneration. Lancet Neurol. (2013) 12:822–38. doi: 10.1016/S1474-4422(13)70124-8
89. Schneider JA, Arvanitakis Z, Bang W, Bennett DA. Mixed brain pathologies account for most dementia cases in community-dwelling older persons. Neurology. (2007) 69:2197–204. doi: 10.1212/01.wnl.0000271090.28148.24
90. Kim HW, Hong J, Jeon JC. Cerebral small vessel disease and Alzheimer's disease: a review. Front Neurol. (2020) 11:927. doi: 10.3389/fneur.2020.00927
91. Wardlaw JM, Smith C, Dichgans M. Mechanisms of sporadic cerebral small vessel disease: insights from neuroimaging. Lancet Neurol. (2013) 12:483–97. doi: 10.1016/S1474-4422(13)70060-7
92. Viswanathan A, Greenberg SM. Cerebral amyloid angiopathy in the elderly. Ann Neurol. (2011) 70:871–80. doi: 10.1002/ana.22516
93. Pantoni L. Cerebral small vessel disease: from pathogenesis and clinical characteristics to therapeutic challenges. Lancet Neurol. (2010) 9:689–701. doi: 10.1016/S1474-4422(10)70104-6
94. Nezu T, Hosomi N, Aoki S, Kubo S, Araki M, Mukai T, et al. Endothelial dysfunction is associated with the severity of cerebral small vessel disease. Hypertens Res. (2015) 38:291–7. doi: 10.1038/hr.2015.4
95. Blair GW, Doubal FN, Thrippleton MJ, Marshall I, Wardlaw JM. Magnetic resonance imaging for assessment of cerebrovascular reactivity in cerebral small vessel disease: a systematic review. J Cereb Blood Flow Metab. (2016) 36:833–41. doi: 10.1177/0271678X16631756
96. Thrippleton MJ, Shi Y, Blair G, Hamilton I, Waiter G, Schwarzbauer C, et al. Cerebrovascular reactivity measurement in cerebral small vessel disease: rationale and reproducibility of a protocol for MRI acquisition and image processing. Int J Stroke. (2018) 13:195–206. doi: 10.1177/1747493017730740
97. Cantin S, Villien M, Moreaud O, Tropres I, Keignart S, Chipon E, et al. Impaired cerebral vasoreactivity to CO2 in Alzheimer's disease using BOLD fMRI. Neuroimage. (2011) 58:579–87. doi: 10.1016/j.neuroimage.2011.06.070
98. Yezhuvath US, Uh J, Cheng Y, Martin-Cook K, Weiner M, Diaz-Arrastia R, et al. Forebrain-dominant deficit in cerebrovascular reactivity in Alzheimer's disease. Neurobiol Aging. (2012) 33:75–82. doi: 10.1016/j.neurobiolaging.2010.02.005
99. Blair GW, Thrippleton MJ, Shi Y, Hamilton I, Stringer M, Chappell F, et al. Intracranial hemodynamic relationships in patients with cerebral small vessel disease. Neurology. (2020) 94:e2258–e69. doi: 10.1212/WNL.0000000000009483
100. Liem MK, Lesnik Oberstein SA, Haan J, Boom R, Ferrari MD, Buchem MA, et al. Cerebrovascular reactivity is a main determinant of white matter hyperintensity progression in CADASIL. AJNR Am J Neuroradiol. (2009) 30:1244–7. doi: 10.3174/ajnr.A1533
101. Atwi S, Shao H, Crane DE, da Costa L, Aviv RI, Mikulis DJ, et al. BOLD-based cerebrovascular reactivity vascular transfer function isolates amplitude and timing responses to better characterize cerebral small vessel disease. NMR Biomed. (2019) 32:e4064. doi: 10.1002/nbm.4064
102. Sam K, Crawley AP, Conklin J, Poublanc J, Sobczyk O, Mandell DM, et al. Development of white matter hyperintensity is preceded by reduced cerebrovascular reactivity. Ann Neurol. (2016) 80:277–85. doi: 10.1002/ana.24712
103. Xu X, Hilal S, Collinson SL, Chong EJ, Ikram MK, Venketasubramanian N, et al. Association of magnetic resonance imaging markers of cerebrovascular disease burden and cognition. Stroke. (2015) 46:2808–14. doi: 10.1161/STROKEAHA.115.010700
104. Jokinen H, Koikkalainen J, Laakso HM, Melkas S, Nieminen T, Brander A, et al. Global burden of small vessel disease-related brain changes on MRI predicts cognitive and functional decline. Stroke. (2020) 51:170–8. doi: 10.1161/STROKEAHA.119.026170
105. Wang Y, Yang Y, Wang T, Nie S, Yin H, Liu J. Correlation between white matter hyperintensities related gray matter volume and cognition in cerebral small vessel disease. J Stroke Cerebrovasc Dis. (2020) 29:105275. doi: 10.1016/j.jstrokecerebrovasdis.2020.105275
106. Saridin FN, Hilal S, Villaraza SG, Reilhac A, Gyanwali B, Tanaka T, et al. Brain amyloid β, cerebral small vessel disease, and cognition: a memory clinic study. Neurology. (2020) 95:e2845–53. doi: 10.1212/WNL.0000000000011029
107. Rosenberg GA, Wallin A, Wardlaw JM, Markus HS, Montaner J, Wolfson L, et al. Consensus statement for diagnosis of subcortical small vessel disease. J Cereb Blood Flow Metab. (2016) 36:6–25. doi: 10.1038/jcbfm.2015.172
108. Hamilton OKL, Backhouse EV, Janssen E, Jochems ACC, Maher C, Ritakari TE, et al. Cognitive impairment in sporadic cerebral small vessel disease: a systematic review and meta-analysis. Alzheimers Dement. (2020) 1–21. doi: 10.1002/alz.12221
109. Dey AK, Stamenova V, Bacopulos A, Jeyakumar N, Turner GR, Black SE, et al. Cognitive heterogeneity among community-dwelling older adults with cerebral small vessel disease. Neurobiol Aging. (2019) 77:183–93. doi: 10.1016/j.neurobiolaging.2018.12.011
110. Su N, Liang X, Zhai FF, Zhou LX, Ni J, Yao M, et al. The consequence of cerebral small vessel disease: linking brain atrophy to motor impairment in the elderly. Hum Brain Mapp. (2018) 39:4452–61. doi: 10.1002/hbm.24284
111. Metoki A, Brookes RL, Zeestraten E, Lawrence AJ, Morris RG, Barrick TR, et al. Mnemonic function in small vessel disease and associations with white matter tract microstructure. Neuropsychologia. (2017) 104:1–7. doi: 10.1016/j.neuropsychologia.2017.07.027
112. Cao WW, Wang Y, Dong Q, Chen X, Li YS, Zhou Y, et al. Deep microbleeds and periventricular white matter disintegrity are independent predictors of attention/executive dysfunction in non-dementia patients with small vessel disease. Int Psychogeriatr. (2017) 29:793–803. doi: 10.1017/S1041610216002118
113. Lawrence AJ, Brookes RL, Zeestraten EA, Barrick TR, Morris RG, Markus HS. Pattern and rate of cognitive decline in cerebral small vessel disease: a prospective study. PLoS ONE. (2015) 10:e0135523. doi: 10.1371/journal.pone.0135523
114. Herbert V, Brookes RL, Markus HS, Morris RG. Verbal fluency in cerebral small vessel disease and Alzheimer's disease. J Int Neuropsychol Soc. (2014) 20:413–21. doi: 10.1017/S1355617714000101
115. Harvey PD. Domains of cognition and their assessment. Dialogues Clin Neurosci. (2019) 21:227–37. doi: 10.31887/DCNS.2019.21.3/pharvey
116. Peca S, McCreary CR, Donaldson E, Kumarpillai G, Shobha N, Sanchez K, et al. Neurovascular decoupling is associated with severity of cerebral amyloid angiopathy. Neurology. (2013) 81:1659–65. doi: 10.1212/01.wnl.0000435291.49598.54
117. Switzer AR, McCreary C, Batool S, Stafford RB, Frayne R, Goodyear BG, et al. Longitudinal decrease in blood oxygenation level dependent response in cerebral amyloid angiopathy. Neuroimage Clin. (2016) 11:461–7. doi: 10.1016/j.nicl.2016.02.020
118. Cheema I, Switzer AR, McCreary CR, Hill MD, Frayne R, Goodyear BG, et al. Functional magnetic resonance imaging responses in CADASIL. J Neurol Sci. (2017) 375:248–54. doi: 10.1016/j.jns.2017.02.004
119. Atwi S, Metcalfe AWS, Robertson AD, Rezmovitz J, Anderson ND, MacIntosh BJ. Attention-related brain activation is altered in older adults with white matter hyperintensities using multi-echo fMRI. Front Neurosci. (2018) 12:748. doi: 10.3389/fnins.2018.00748
120. Schaefer A, Quinque EM, Kipping JA, Arélin K, Roggenhofer E, Frisch S, et al. Early small vessel disease affects frontoparietal and cerebellar hubs in close correlation with clinical symptoms–a resting-state fMRI study. J Cereb Blood Flow Metab. (2014) 34:1091–5. doi: 10.1038/jcbfm.2014.70
121. Suzuki J, Kodama N. Moyamoya disease–a review. Stroke. (1983) 14:104–9. doi: 10.1161/01.STR.14.1.104
122. Guzman R, Lee M, Achrol A, Bell-Stephens T, Kelly M, Do HM, et al. Clinical outcome after 450 revascularization procedures for moyamoya disease. Clinical article. J Neurosurg. (2009) 111:927–35. doi: 10.3171/2009.4.JNS081649
123. Heyn C, Poublanc J, Crawley A, Mandell D, Han JS, Tymianski M, et al. Quantification of cerebrovascular reactivity by blood oxygen level-dependent MR imaging and correlation with conventional angiography in patients with Moyamoya disease. AJNR Am J Neuroradiol. (2010) 31:862–7. doi: 10.3174/ajnr.A1922
124. Mandell DM, Han JS, Poublanc J, Crawley AP, Kassner A, Fisher JA, et al. Selective reduction of blood flow to white matter during hypercapnia corresponds with leukoaraiosis. Stroke. (2008) 39:1993–8. doi: 10.1161/STROKEAHA.107.501692
125. Mazerolle EL, Ma Y, Sinclair D, Pike GB. Task-dependent neurovascular uncoupling in Moyamoya disease. In: 23rd Scientific Meeting of the International Society for Magnetic Resonance in Medicine. Toronto, ON (2015).
126. Sam K, Poublanc J, Sobczyk O, Han JS, Battisti-Charbonney A, Mandell DM, et al. Assessing the effect of unilateral cerebral revascularisation on the vascular reactivity of the non-intervened hemisphere: a retrospective observational study. BMJ Open. (2015) 5:e006014. doi: 10.1136/bmjopen-2014-006014
127. Webster MW, Makaroun MS, Steed DL, Smith HA, Johnson DW, Yonas H. Compromised cerebral blood flow reactivity is a predictor of stroke in patients with symptomatic carotid artery occlusive disease. J Vasc Surg. (1995) 21:338–44; discussion 44–5. doi: 10.1016/S0741-5214(95)70274-1
128. Schoof J, Lubahn W, Baeumer M, Kross R, Wallesch CW, Kozian A, et al. Impaired cerebral autoregulation distal to carotid stenosis/occlusion is associated with increased risk of stroke at cardiac surgery with cardiopulmonary bypass. J Thorac Cardiovasc Surg. (2007) 134:690–6. doi: 10.1016/j.jtcvs.2007.03.018
129. Fierstra J, Poublanc J, Han JS, Silver F, Tymianski M, Crawley AP, et al. Steal physiology is spatially associated with cortical thinning. J Neurol Neurosurg Psychiatry. (2010) 81:290–3. doi: 10.1136/jnnp.2009.188078
130. Conklin J, Fierstra J, Crawley AP, Han JS, Poublanc J, Mandell DM, et al. Impaired cerebrovascular reactivity with steal phenomenon is associated with increased diffusion in white matter of patients with Moyamoya disease. Stroke. (2010) 41:1610–6. doi: 10.1161/STROKEAHA.110.579540
131. Mandell DM, Han JS, Poublanc J, Crawley AP, Fierstra J, Tymianski M, et al. Quantitative measurement of cerebrovascular reactivity by blood oxygen level-dependent MR imaging in patients with intracranial stenosis: preoperative cerebrovascular reactivity predicts the effect of extracranial-intracranial bypass surgery. AJNR Am J Neuroradiol. (2011) 32:721–7. doi: 10.3174/ajnr.A2365
132. McKetton L, Venkatraghavan L, Rosen C, Mandell DM, Sam K, Sobczyk O, et al. Improved white matter cerebrovascular reactivity after revascularization in patients with steno-occlusive disease. AJNR Am J Neuroradiol. (2019) 40:45–50. doi: 10.3174/ajnr.A5912
133. Kronenburg A, van den Berg E, van Schooneveld MM, Braun KPJ, Calviere L, van der Zwan A, et al. Cognitive functions in children and adults with moyamoya vasculopathy: a systematic review and meta-analysis. J Stroke. (2018) 20:332–41. doi: 10.5853/jos.2018.01550
134. He S, Duan R, Liu Z, Ye X, Yuan L, Li T, et al. Characteristics of cognitive impairment in adult asymptomatic moyamoya disease. BMC Neurol. (2020) 20:322. doi: 10.1186/s12883-020-01898-8
135. Shi Z, Wen YJ, Huang Z, Yu LB, Zhang D. Different aspects of cognitive function in adult patients with moyamoya disease and its clinical subtypes. Stroke Vasc Neurol. (2020) 5:86–96. doi: 10.1136/svn-2019-000309
136. Miyoshi K, Chida K, Kobayashi M, Kubo Y, Yoshida K, Terasaki K, et al. Two-year clinical, cerebral hemodynamic, and cognitive outcomes of adult patients undergoing medication alone for symptomatically ischemic moyamoya disease without cerebral misery perfusion: a prospective cohort study. Neurosurgery. (2019) 84:1233–41. doi: 10.1093/neuros/nyy234
137. Fang L, Huang J, Zhang Q, Chan RC, Wang R, Wan W. Different aspects of dysexecutive syndrome in patients with moyamoya disease and its clinical subtypes. J Neurosurg. (2016) 125:299–307. doi: 10.3171/2015.7.JNS142666
138. Calviere L, Catalaa I, Marlats F, Viguier A, Bonneville F, Cognard C, et al. Correlation between cognitive impairment and cerebral hemodynamic disturbances on perfusion magnetic resonance imaging in European adults with moyamoya disease. Clinical article. J Neurosurg. (2010) 113:753–9. doi: 10.3171/2010.4.JNS091808
139. Hara S, Hori M, Murata S, Ueda R, Tanaka Y, Inaji M, et al. Microstructural damage in normal-appearing brain parenchyma and neurocognitive dysfunction in adult moyamoya disease. Stroke. (2018) 49:2504–7. doi: 10.1161/STROKEAHA.118.022367
140. Mazerolle EL, Ma Y, Sinclair D, Pike GB. Impact of abnormal cerebrovascular reactivity on BOLD fMRI: a preliminary investigation of moyamoya disease. Clin Physiol Funct Imaging. (2018) 38:87–92. doi: 10.1111/cpf.12387
141. Hauser SL, Cree BAC. Treatment of multiple sclerosis: a Review. Am J Med. (2020) 133:1380–90.e2. doi: 10.1016/j.amjmed.2020.05.049
142. Lublin FD, Reingold SC, Cohen JA, Cutter GR, Sørensen PS, Thompson AJ, et al. Defining the clinical course of multiple sclerosis: the 2013 revisions. Neurology. (2014) 83:278–86. doi: 10.1212/WNL.0000000000000560
143. Filippi M, Preziosa P, Banwell BL, Barkhof F, Ciccarelli O, De Stefano N, et al. Assessment of lesions on magnetic resonance imaging in multiple sclerosis: practical guidelines. Brain. (2019) 142:1858–75. doi: 10.1093/brain/awz144
144. Moll NM, Rietsch AM, Thomas S, Ransohoff AJ, Lee JC, Fox R, et al. Multiple sclerosis normal-appearing white matter: pathology-imaging correlations. Ann Neurol. (2011) 70:764–73. doi: 10.1002/ana.22521
145. Pike GB, De Stefano N, Narayanan S, Worsley KJ, Pelletier D, Francis GS, et al. Multiple sclerosis: magnetization transfer MR imaging of white matter before lesion appearance on T2-weighted images. Radiology. (2000) 215:824–30. doi: 10.1148/radiology.215.3.r00jn02824
146. Frohman EM, Racke MK, Raine CS. Multiple sclerosis–the plaque and its pathogenesis. N Engl J Med. (2006) 354:942–55. doi: 10.1056/NEJMra052130
147. D'haeseleer M, Cambron M, Vanopdenbosch L, De Keyser J. Vascular aspects of multiple sclerosis. Lancet Neurol. (2011) 10:657–66. doi: 10.1016/S1474-4422(11)70105-3
148. Ota M, Sato N, Nakata Y, Ito K, Kamiya K, Maikusa N, et al. Abnormalities of cerebral blood flow in multiple sclerosis: a pseudocontinuous arterial spin labeling MRI study. Magn Reson Imaging. (2013) 31:990–5. doi: 10.1016/j.mri.2013.03.016
149. Law M, Saindane AM, Ge Y, Babb JS, Johnson G, Mannon LJ, et al. Microvascular abnormality in relapsing-remitting multiple sclerosis: perfusion MR imaging findings in normal-appearing white matter. Radiology. (2004) 231:645–52. doi: 10.1148/radiol.2313030996
150. Lattanzi S, Acciarri MC, Danni M, Taffi R, Cerqua R, Rocchi C, et al. Cerebral hemodynamics in patients with multiple sclerosis. Mult Scler Relat Disord. (2020) 44:102309. doi: 10.1016/j.msard.2020.102309
151. Marshall O, Lu H, Brisset JC, Xu F, Liu P, Herbert J, et al. Impaired cerebrovascular reactivity in multiple sclerosis. JAMA Neurol. (2014) 71:1275–81. doi: 10.1001/jamaneurol.2014.1668
152. Pelizzari L, Laganà MM, Baglio F, Bergsland N, Cecconi P, Viotti S, et al. Cerebrovascular reactivity and its correlation with age in patients with multiple sclerosis. Brain Imaging Behav. (2019) 14:1889–98. doi: 10.1007/s11682-019-00132-5
153. Uzuner N, Ozkan S, Cinar N. Cerebrovascular reactivity in multiple sclerosis patients. Mult Scler. (2007) 13:737–41. doi: 10.1177/1352458506074645
154. Metzger A, Le Bars E, Deverdun J, Molino F, Maréchal B, Picot MC, et al. Is impaired cerebral vasoreactivity an early marker of cognitive decline in multiple sclerosis patients? Eur Radiol. (2018) 28:1204–14. doi: 10.1007/s00330-017-5068-5
155. Goitia B, Bruno D, Abrevaya S, Sedeño L, Ibáñez A, Manes F, et al. The relationship between executive functions and fluid intelligence in multiple sclerosis. PLoS ONE. (2020) 15:e0231868. doi: 10.1371/journal.pone.0231868
156. Pitteri M, Dapor C, Ziccardi S, Guandalini M, Meggiato R, Calabrese M. Visual-attentional load unveils slowed processing speed in multiple sclerosis patients: a pilot study with a tablet-based videogame. Brain Sci. (2020) 10:871. doi: 10.3390/brainsci10110871
157. Carotenuto A, Costabile T, Moccia M, Falco F, Scala MR, Russo CV, et al. Olfactory function and cognition in relapsing-remitting and secondary-progressive multiple sclerosis. Mult Scler Relat Disord. (2019) 27:1–6. doi: 10.1016/j.msard.2018.09.024
158. Kouvatsou Z, Masoura E, Kiosseoglou G, Kimiskidis VK. Working memory profiles of patients with multiple sclerosis: Where does the impairment lie? J Clin Exp Neuropsychol. (2019) 41:832–44. doi: 10.1080/13803395.2019.1626805
159. Aladro Y, López-Alvarez L, Sánchez-Reyes JM, Hernández-Tamames JA, Melero H, Rubio-Fernández S, et al. Relationship between episodic memory and volume of the brain regions of two functional cortical memory systems in multiple sclerosis. J Neurol. (2018) 265:2182–9. doi: 10.1007/s00415-018-8965-x
160. Migliore S, Curcio G, Couyoumdjian A, Ghazaryan A, Landi D, Moffa F, et al. Executive functioning in relapsing-remitting multiple sclerosis patients without cognitive impairment: A task-switching protocol. Mult Scler. (2018) 24:1328–36. doi: 10.1177/1352458517719149
161. Planche V, Gibelin M, Cregut D, Pereira B, Clavelou P. Cognitive impairment in a population-based study of patients with multiple sclerosis: differences between late relapsing-remitting, secondary progressive and primary progressive multiple sclerosis. Eur J Neurol. (2016) 23:282–9. doi: 10.1111/ene.12715
162. Roth AK, Denney DR, Lynch SG. Information processing speed and attention in multiple sclerosis: reconsidering the attention network test (ANT). J Clin Exp Neuropsychol. (2015) 37:518–29. doi: 10.1080/13803395.2015.1037252
163. Nasios G, Bakirtzis C, Messinis L. Cognitive impairment and brain reorganization in MS: underlying mechanisms and the role of neurorehabilitation. Front Neurol. (2020) 11:147. doi: 10.3389/fneur.2020.00147
164. Mainero C, Caramia F, Pozzilli C, Pisani A, Pestalozza I, Borriello G, et al. fMRI evidence of brain reorganization during attention and memory tasks in multiple sclerosis. Neuroimage. (2004) 21:858–67. doi: 10.1016/j.neuroimage.2003.10.004
165. Rocca MA, Valsasina P, Hulst HE, Abdel-Aziz K, Enzinger C, Gallo A, et al. Functional correlates of cognitive dysfunction in multiple sclerosis: a multicenter fMRI study. Hum Brain Mapp. (2014) 35:5799–814. doi: 10.1002/hbm.22586
166. Forn C, Barros-Loscertales A, Escudero J, Belloch V, Campos S, Parcet MA, et al. Cortical reorganization during PASAT task in MS patients with preserved working memory functions. Neuroimage. (2006) 31:686–91. doi: 10.1016/j.neuroimage.2005.12.030
167. Staffen W, Mair A, Zauner H, Unterrainer J, Niederhofer H, Kutzelnigg A, et al. Cognitive function and fMRI in patients with multiple sclerosis: evidence for compensatory cortical activation during an attention task. Brain. (2002) 125(Pt 6):1275–82. doi: 10.1093/brain/awf125
168. Iancheva D, Trenova A, Mantarova S, Terziyski K. Functional magnetic resonance imaging correlations between fatigue and cognitive performance in patients with relapsing remitting multiple sclerosis. Front Psychiatry. (2019) 10:754. doi: 10.3389/fpsyt.2019.00754
169. Loitfelder M, Fazekas F, Petrovic K, Fuchs S, Ropele S, Wallner-Blazek M, et al. Reorganization in cognitive networks with progression of multiple sclerosis: insights from fMRI. Neurology. (2011) 76:526–33. doi: 10.1212/WNL.0b013e31820b75cf
170. Ferré S. An update on the mechanisms of the psychostimulant effects of caffeine. J Neurochem. (2008) 105:1067–79. doi: 10.1111/j.1471-4159.2007.05196.x
171. Ko KR, Ngai AC, Winn HR. Role of adenosine in regulation of regional cerebral blood flow in sensory cortex. Am J Physiol. (1990) 259(6 Pt 2):H1703–8. doi: 10.1152/ajpheart.1990.259.6.H1703
172. Addicott MA, Yang LL, Peiffer AM, Burnett LR, Burdette JH, Chen MY, et al. The effect of daily caffeine use on cerebral blood flow: how much caffeine can we tolerate? Hum Brain Mapp. (2009) 30:3102–14. doi: 10.1002/hbm.20732
173. Pelligrino DA, Xu HL, Vetri F. Caffeine and the control of cerebral hemodynamics. J Alzheimers Dis. (2010) 20(Suppl. 1):S51–62. doi: 10.3233/JAD-2010-091261
174. Buch S, Ye Y, Haacke EM. Quantifying the changes in oxygen extraction fraction and cerebral activity caused by caffeine and acetazolamide. J Cereb Blood Flow Metab. (2017) 37:825–36. doi: 10.1177/0271678X16641129
175. Perthen JE, Lansing AE, Liau J, Liu TT, Buxton RB. Caffeine-induced uncoupling of cerebral blood flow and oxygen metabolism: a calibrated BOLD fMRI study. Neuroimage. (2008) 40:237–47. doi: 10.1016/j.neuroimage.2007.10.049
176. Merola A, Germuska MA, Warnert EA, Richmond L, Helme D, Khot S, et al. Mapping the pharmacological modulation of brain oxygen metabolism: the effects of caffeine on absolute CMRO. Neuroimage. (2017) 155:331–43. doi: 10.1016/j.neuroimage.2017.03.028
177. Xu F, Liu P, Pekar JJ, Lu H. Does acute caffeine ingestion alter brain metabolism in young adults? Neuroimage. (2015) 110:39–47. doi: 10.1016/j.neuroimage.2015.01.046
178. Griffeth VE, Perthen JE, Buxton RB. Prospects for quantitative fMRI: investigating the effects of caffeine on baseline oxygen metabolism and the response to a visual stimulus in humans. Neuroimage. (2011) 57:809–16. doi: 10.1016/j.neuroimage.2011.04.064
179. Chen Y, Parrish TB. Caffeine's effects on cerebrovascular reactivity and coupling between cerebral blood flow and oxygen metabolism. Neuroimage. (2009) 44:647–52. doi: 10.1016/j.neuroimage.2008.09.057
180. Specht JL, Williams RJ, Mazerolle EL, Pike GB. Hypercapnic normalization to correct for caffeine-induced changes in task-based BOLD fMRI responses. In: 27th International Society for Magnetic Resonance in Medicine Annual Meeting. Montreal, QC (2019).
181. Mulderink TA, Gitelman DR, Mesulam MM, Parrish TB. On the use of caffeine as a contrast booster for BOLD fMRI studies. Neuroimage. (2002) 15:37–44. doi: 10.1006/nimg.2001.0973
182. Laurienti PJ, Field AS, Burdette JH, Maldjian JA, Yen YF, Moody DM. Relationship between caffeine-induced changes in resting cerebral perfusion and blood oxygenation level-dependent signal. AJNR Am J Neuroradiol. (2003) 24:1607–11. Available online at: http://www.ajnr.org/content/24/8/1607.long
183. Nehlig A. Is caffeine a cognitive enhancer? J Alzheimers Dis. (2010) 20(Suppl. 1):S85–94. doi: 10.3233/JAD-2010-091315
184. McLellan TM, Caldwell JA, Lieberman HR. A review of caffeine's effects on cognitive, physical and occupational performance. Neurosci Biobehav Rev. (2016) 71:294–312. doi: 10.1016/j.neubiorev.2016.09.001
185. Liau J, Perthen JE, Liu TT. Caffeine reduces the activation extent and contrast-to-noise ratio of the functional cerebral blood flow response but not the BOLD response. Neuroimage. (2008) 42:296–305. doi: 10.1016/j.neuroimage.2008.04.177
186. Park CA, Kang CK, Son YD, Choi EJ, Kim SH, Oh ST, et al. The effects of caffeine ingestion on cortical areas: functional imaging study. Magn Reson Imaging. (2014) 32:366–71. doi: 10.1016/j.mri.2013.12.018
187. Koppelstaetter F, Poeppel TD, Siedentopf CM, Ischebeck A, Verius M, Haala I, et al. Does caffeine modulate verbal working memory processes? An fMRI study. Neuroimage. (2008) 39:492–9. doi: 10.1016/j.neuroimage.2007.08.037
188. Diukova A, Ware J, Smith JE, Evans CJ, Murphy K, Rogers PJ, et al. Separating neural and vascular effects of caffeine using simultaneous EEG-FMRI: differential effects of caffeine on cognitive and sensorimotor brain responses. Neuroimage. (2012) 62:239–49. doi: 10.1016/j.neuroimage.2012.04.041
189. Haller S, Montandon ML, Rodriguez C, Moser D, Toma S, Hofmeister J, et al. Caffeine impact on working memory-related network activation patterns in early stages of cognitive decline. Neuroradiology. (2017) 59:387–95. doi: 10.1007/s00234-017-1803-5
190. MacDonald ME, Williams RJ, Rajashekar D, Stafford RB, Hanganu A, Sun H, et al. Age related differences in cerebral blood flow and cortical thickness with an application to age prediction. Neurobiol Aging. (2020) 95:131–42. doi: 10.1016/j.neurobiolaging.2020.06.019
191. Salat D, Buckner R, Snyder A, Greve D, Desikan R, Busa E, et al. Thinning of the cerebral cortex in aging. Cerebral Cortex. (2004) 14:721–30. doi: 10.1093/cercor/bhh032
192. Thambisetty M, Wan J, Carass A, An Y, Prince JL, Resnick SM. Longitudinal changes in cortical thickness associated with normal aging. Neuroimage. (2010) 52:1215–23. doi: 10.1016/j.neuroimage.2010.04.258
193. Moeini M, Lu X, Avti PK, Damseh R, Bélanger S, Picard F, et al. Compromised microvascular oxygen delivery increases brain tissue vulnerability with age. Sci Rep. (2018) 8:8219. doi: 10.1038/s41598-018-26543-w
194. Farrall AJ, Wardlaw JM. Blood-brain barrier: ageing and microvascular disease- systematic review and meta-analysis. Neurobiol Aging. (2009) 30:337–52. doi: 10.1016/j.neurobiolaging.2007.07.015
195. Verheggen I, de Jong J, van Boxtel M, Gronenschild E, Palm W, Postma A, et al. Increase in blood-brain barrier leakage in healthy, older adults. Geroscience. (2020) 42:1183–93. doi: 10.1007/s11357-020-00211-2
196. Thorin-Trescases N, de Montgolfier O, Pinçon A, Raignault A, Caland L, Labbé P, et al. Impact of pulse pressure on cerebrovascular events leading to age-related cognitive decline. Am J Physiol Heart Circ Physiol. (2018) 314:H1214–24. doi: 10.1152/ajpheart.00637.2017
197. Pinto E. Blood pressure and ageing. Postgrad Med J. (2007) 83:109–14. doi: 10.1136/pgmj.2006.048371
198. De Vis JB, Hendrikse J, Bhogal A, Adams A, Kappelle LJ, Petersen ET. Age-related changes in brain hemodynamics; a calibrated MRI study. Hum Brain Mapp. (2015) 36:3973–87. doi: 10.1002/hbm.22891
199. Bhogal AA, De Vis JB, Siero JCW, Petersen ET, Luijten PR, Hendrikse J, et al. The BOLD cerebrovascular reactivity response to progressive hypercapnia in young and elderly. Neuroimage. (2016) 139:94–102. doi: 10.1016/j.neuroimage.2016.06.010
200. Lu H, Xu F, Rodrigue KM, Kennedy KM, Cheng Y, Flicker B, et al. Alterations in cerebral metabolic rate and blood supply across the adult lifespan. Cereb Cortex. (2011) 21:1426–34. doi: 10.1093/cercor/bhq224
201. McKetton L, Sobczyk O, Duffin J, Poublanc J, Sam K, Crawley A, et al. The aging brain and cerebrovascular reactivity. Neuroimage. (2018) 181:132–41. doi: 10.1016/j.neuroimage.2018.07.007
202. Catchlove SJ, Parrish TB, Chen Y, Macpherson H, Hughes ME, Pipingas A. Regional cerebrovascular reactivity and cognitive performance in healthy aging. J Exp Neurosci. (2018) 12:1179069518785151. doi: 10.1177/1179069518785151
203. Peng SL, Chen X, Li Y, Rodrigue KM, Park DC, Lu H. Age-related changes in cerebrovascular reactivity and their relationship to cognition: a four-year longitudinal study. Neuroimage. (2018) 174:257–62. doi: 10.1016/j.neuroimage.2018.03.033
204. Barnes JN, Taylor JL, Kluck BN, Johnson CP, Joyner MJ. Cerebrovascular reactivity is associated with maximal aerobic capacity in healthy older adults. J Appl Physiol. (2013) 114:1383–7. doi: 10.1152/japplphysiol.01258.2012
205. Talwar N, Churchill NW, Hird MA, Tam F, Graham SJ, Schweizer TA. Functional magnetic resonance imaging of the trail-making test in older adults. PLoS ONE. (2020) 15:e0232469. doi: 10.1371/journal.pone.0232469
206. Deng ID, Chung L, Talwar N, Tam F, Churchill NW, Schweizer TA, et al. Functional MRI of letter cancellation task performance in older adults. Front Hum Neurosci. (2019) 13:97. doi: 10.3389/fnhum.2019.00097
207. Yaple ZA, Stevens WD, Arsalidou M. Meta-analyses of the n-back working memory task: fMRI evidence of age-related changes in prefrontal cortex involvement across the adult lifespan. Neuroimage. (2019) 196:16–31. doi: 10.1016/j.neuroimage.2019.03.074
208. Fischer H, Nyberg L, Karlsson S, Karlsson P, Brehmer Y, Rieckmann A, et al. Simulating neurocognitive aging: effects of a dopaminergic antagonist on brain activity during working memory. Biol Psychiatry. (2010) 67:575–80. doi: 10.1016/j.biopsych.2009.12.013
209. Nyberg L. Functional brain imaging of episodic memory decline in ageing. J Intern Med. (2017) 281:65–74. doi: 10.1111/joim.12533
210. Stebbins GT, Carrillo MC, Dorfman J, Dirksen C, Desmond JE, Turner DA, et al. Aging effects on memory encoding in the frontal lobes. Psychol Aging. (2002) 17:44–55. doi: 10.1037/0882-7974.17.1.44
211. Schneider-Garces NJ, Gordon BA, Brumback-Peltz CR, Shin E, Lee Y, Sutton BP, et al. Span, CRUNCH, and beyond: working memory capacity and the aging brain. J Cogn Neurosci. (2010) 22:655–69. doi: 10.1162/jocn.2009.21230
212. Reuter-Lorenz P, Cappell K. Neurocognitive aging and the compensation hypothesis. Curr Direct Psychol Sci. (2008) 17:177–82. doi: 10.1111/j.1467-8721.2008.00570.x
213. Cappell K, Gmeindl L, Reuter-Lorenz P. Age differences in prefontal recruitment during verbal working memory maintenance depend on memory load. Cortex. (2010) 46:462–73. doi: 10.1016/j.cortex.2009.11.009
214. Cabeza R, Daselaar SM, Dolcos F, Prince SE, Budde M, Nyberg L. Task-independent and task-specific age effects on brain activity during working memory, visual attention and episodic retrieval. Cereb Cortex. (2004) 14:364–75. doi: 10.1093/cercor/bhg133
215. Cabeza R. Hemispheric asymmetry reduction in older adults: the HAROLD model. Psychol Aging. (2002) 17:85–100. doi: 10.1037/0882-7974.17.1.85
216. Dolcos F, Rice HJ, Cabeza R. Hemispheric asymmetry and aging: right hemisphere decline or asymmetry reduction. Neurosci Biobehav Rev. (2002) 26:819–25. doi: 10.1016/S0149-7634(02)00068-4
217. Cabeza R, Anderson ND, Locantore JK, McIntosh AR. Aging gracefully: compensatory brain activity in high-performing older adults. Neuroimage. (2002) 17:1394–402. doi: 10.1006/nimg.2002.1280
218. Davis SW, Dennis NA, Daselaar SM, Fleck MS, Cabeza R. Que PASA? The posterior-anterior shift in aging. Cereb Cortex. (2008) 18:1201–9. doi: 10.1093/cercor/bhm155
219. Gauthier CJ, Madjar C, Desjardins-Crepeau L, Bellec P, Bherer L, Hoge RD. Age dependence of hemodynamic response characteristics in human functional magnetic resonance imaging. Neurobiol Aging. (2013) 34:1469–85. doi: 10.1016/j.neurobiolaging.2012.11.002
220. Tsvetanov KA, Henson RNA, Rowe JB. Separating vascular and neuronal effects of age on fMRI BOLD signals. Philos Trans R Soc Lond B Biol Sci. (2021) 376:20190631. doi: 10.1098/rstb.2019.0631
221. Bandettini PA, Wong EC. A hypercapnia-based normalization method for improved spatial localization of human brain activation with fMRI. NMR Biomed. (1997) 10:197–203. doi: 10.1002/(SICI)1099-1492(199706/08)10:4/5<197::AID-NBM466>3.0.CO;2-S
222. Cohen ER, Rostrup E, Sidaros K, Lund TE, Paulson OB, Ugurbil K, et al. Hypercapnic normalization of BOLD fMRI: comparison across field strengths and pulse sequences. Neuroimage. (2004) 23:613–24. doi: 10.1016/j.neuroimage.2004.06.021
223. Biswal BB, Kannurpatti SS, Rypma B. Hemodynamic scaling of fMRI-BOLD signal: validation of low-frequency spectral amplitude as a scalability factor. Magn Reson Imaging. (2007) 25:1358–69. doi: 10.1016/j.mri.2007.03.022
224. Thomason ME, Foland LC, Glover GH. Calibration of BOLD fMRI using breath holding reduces group variance during a cognitive task. Hum Brain Mapp. (2007) 28:59–68. doi: 10.1002/hbm.20241
225. Liau J, Liu TT. Inter-subject variability in hypercapnic normalization of the BOLD fMRI response. Neuroimage. (2009) 45:420–30. doi: 10.1016/j.neuroimage.2008.11.032
226. Liu P, Hebrank AC, Rodrigue KM, Kennedy KM, Section J, Park DC, et al. Age-related differences in memory-encoding fMRI responses after accounting for decline in vascular reactivity. NeuroImage. (2013) 78:415–25. doi: 10.1016/j.neuroimage.2013.04.053
Keywords: functional magnetic resonance imaging, cerebrovascular reactivity, cognition, aging, caffeine, multiple sclerois, Moyamoya, small vessel disease
Citation: Williams RJ, MacDonald ME, Mazerolle EL and Pike GB (2021) The Relationship Between Cognition and Cerebrovascular Reactivity: Implications for Task-Based fMRI. Front. Phys. 9:645249. doi: 10.3389/fphy.2021.645249
Received: 23 December 2020; Accepted: 11 March 2021;
Published: 12 April 2021.
Edited by:
James Duffin, University of Toronto, CanadaReviewed by:
Jean Chen, University of Toronto, CanadaTommaso Gili, IMT School for Advanced Studies Lucca, Italy
Copyright © 2021 Williams, MacDonald, Mazerolle and Pike. This is an open-access article distributed under the terms of the Creative Commons Attribution License (CC BY). The use, distribution or reproduction in other forums is permitted, provided the original author(s) and the copyright owner(s) are credited and that the original publication in this journal is cited, in accordance with accepted academic practice. No use, distribution or reproduction is permitted which does not comply with these terms.
*Correspondence: Rebecca J. Williams, rjwillia@ucalgary.ca; orcid.org/0000-0002-8949-1197